Download
1 / 28
290 likes | 592 Views
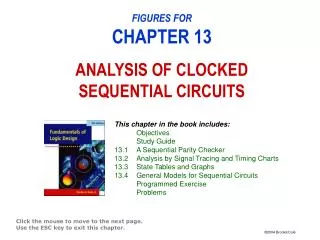
This chapter in the book includes: Objectives Study Guide 13.1 A Sequential Parity Checker 13.2 Analysis by Signal Tracing and Timing Charts 13.3 State Tables and Graphs 13.4 General Models for Sequential Circuits Programmed Exercise Problems.

E N D
This chapter in the book includes: Objectives Study Guide 13.1 A Sequential Parity Checker 13.2 Analysis by Signal Tracing and Timing Charts 13.3 State Tables and Graphs 13.4 General Models for Sequential Circuits Programmed Exercise Problems FIGURES FORCHAPTER 13ANALYSIS OF CLOCKED SEQUENTIAL CIRCUITS Click the mouse to move to the next page. Use the ESC key to exit this chapter.
Figure 13-17:General Model for Mealy Circuit Using ClockedD Flip-Flops
Figure 13-19: General Model for Moore Circuit Using Clocked D Flip-Flops