Download
1 / 16
160 likes | 256 Views
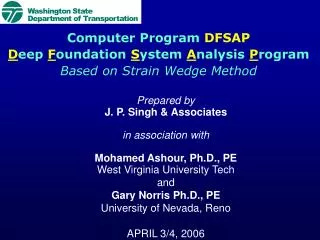
This computer program helps analyze axially loaded piles/shafts in layered soils (sand/clay) by assessing stress distribution, shear forces, deformations, and load transfers. Developed by J. P. Singh & Associates in collaboration with experts from West Virginia University Tech and University of Nevada, Reno in April 2006.

E N D
Computer Program DFSAPDeep Foundation System Analysis ProgramBased on Strain Wedge Method • Prepared by • J. P. Singh & Associates • in association with • Mohamed Ashour, Ph.D., PE • West Virginia University Tech • and • Gary Norris Ph.D., PE • University of Nevada, Reno • APRIL 3/4, 2006
Qo X Vert. Shear Stress distribution Loading Direction q Shaft Cross Section Sheared soil layers Deformations in soil layers around an axially loaded shafts X Shear Stress, T-Z curve o n Shear Stress, T n + m Distance Zn + m QT zn Shaft zmax ro rn rn + m Shaft Vertical Displacement, Z Displacement, z Vertical Shear Stress Shaft Cross Section
Layer 1 Layer 2 Layer 3
A Comparison Between Measured and Computed Axial Pile Load at Different Depths (After Vesic, 1970)
Fig. 3-15 Comparison Between Measured and Predicted Load Transfer () – Pile Movement (z) Curve for the California Test
Predicted Axial Load Distribution along the Pile Pile-Head Load-Settlement Curves for Seven Loading Tests at Different Time Periods for the California Test in Comparison with the Predicted Results
Layer 1 Layer 2 = 320 Layer 3 Liquefiable soil Effect of Developing Liquefaction on Axial Capacity of a Pile from FHWA/RD/86/102 Clay Layer 4
Effect of Soil Liquefaction on the T-z Curve No Liquefaction amax = 0.25g, M = 6.5 amax = 0.40g, M = 6.5
Ks = 14.2 x 10⁶ lb/ft Ks = 14.4 x 10⁷ lb/ft Pile Axial Stiffness Using DFSAP vs. FHWA/RD/86/102
Lateral Load D j m Sloping Ground j C D m j (h-x) tan b tan m m j m B x h b m Different Failure Planes h-x Piles/Shafts in Sloping Ground
0 Degree Sloping Ground 10 Degree Sloping Ground
500 G r o u n d S l o p e 0 D e g r e e s p 1 0 D e g r e e i 400 k 2 0 D e g r e e , o P , d 300 a o L d a 200 e H - t f a h 100 S 0 0 4 8 12 S h a f t D e f l e c t i o n , Y , i n o Effect of Ground Slope on Pile/Shaft Lateral Response (Downhill Loading)
Effect of Ground Slope on Pile/Shaft Lateral Response (Uphill Loading)