Download
1 / 28
280 likes | 569 Views
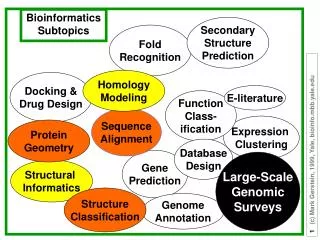
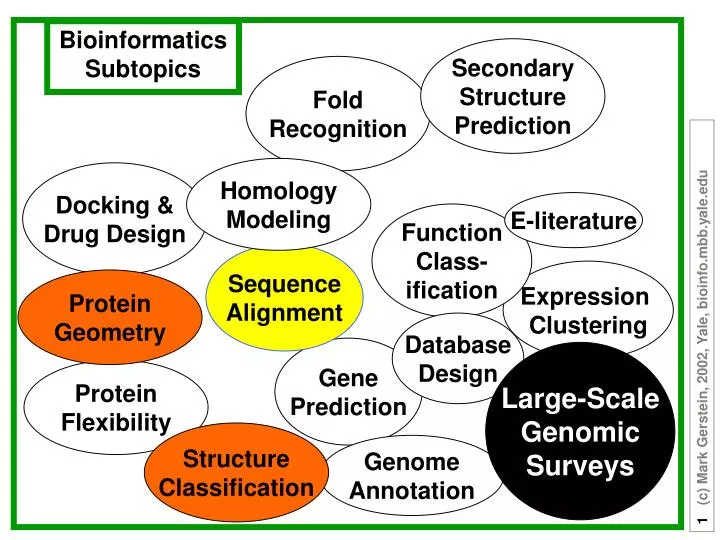
Bioinformatics Subtopics. Secondary Structure Prediction. Fold Recognition. Homology Modeling. Docking & Drug Design. E-literature. Function Class- ification. Sequence Alignment. Expression Clustering. Protein Geometry. Database Design. Gene Prediction. Large-Scale Genomic Surveys.

E N D
Bioinformatics Subtopics SecondaryStructurePrediction FoldRecognition HomologyModeling Docking &Drug Design E-literature FunctionClass-ification SequenceAlignment Expression Clustering ProteinGeometry DatabaseDesign GenePrediction Large-ScaleGenomicSurveys ProteinFlexibility StructureClassification GenomeAnnotation
Databases NCBI GenBank- Protein and DNA sequence NCBI Human Map - Human Genome Viewer NCBI Ensembl - Genome browsers for human, mouse, zebra fish, mosquito TIGR - The Institute for Genome Research SwissProt - Protein Sequence and Function ProDom - Protein Domains Pfam - Protein domain families ProSite - Protein Sequence Motifs Protein Data Base (PDB) - Coordinates for Protein 3D structures SCOP Database- Domain structures organized into evolutionary families HSSP - Domain database using Dali FlyBase WormBase PubMed / MedLine Sequence Alignment Tools BLAST Clustal MSAs FASTA PSI-Blast Hidden Markov Models 3D Structure Alignments / Classifications Dali VAST PRISM CATH SCOP Some Specific “Informatics” toolsof Bioinformatics
Raw Data ???T C A T G C A T T G 2 matches, 0 gaps T C A T G | |C A T T G 3 matches (2 end gaps) T C A T G . | | | . C A T T G 4 matches, 1 insertion T C A - T G | | | | . C A T T G 4 matches, 1 insertion T C A T - G | | | | . C A T T G Aligning Text Strings and Gaps
Each sequence alignment has a “bit score” or “similarity score” (S), a measure of the similarity between the hit and the query; normalized for “effective length" The E-value of the hit is the number of alignments in the database you are searching with similarity score ≥ S that you expect to find by chance; likelihood of the match relative to a pair of random sequences with the same amino acid composition E = 10-50. Much more likely than a random occurrence E = 10-5. This could be an accidental event E = 1. It is easy to find another hit in the database that is as The lower the Expect Value (E_val), the more significant the “hit” Sequence Alignment E-value: Expect Value
Similarity Score (Bit Score): Higher similarity score (e.g., high % seq id) corresponds to smaller E-value Length of the query: Since a particular Similarity Score is more easily obtained by chance with a longer query sequence, longer queries correspond to larger E-values Size of the database: Since a larger database makes a particular Similarity Score easier to obtain, a larger database results in larger E-values E-value Expect ValueDepends on:
Raw Score: calculated by counting the number of identities, mismatches, gaps, etc in the alignment Bit Score: Normalizes the “raw score” to provide a measure of sequence similarity that is independent of the scoring system E-value: E = mn2-S where m - “effective length of the query” (accounts for the fact that ends may not line up); n - length of the database (number of residues or bases) S - Bit score Calculating E-val:
Simple Score S = Total Score S(i,j) = similarity matrix score for aligning residues i and j Sum is carried out over all aligned i and j residues n = number of gaps G = gap penalty Simplest score - for “identity match matrix” S(i,j) = 1 if matches S(I,j) = 0 otherwise
Raw Data ???T C A T G C A T T G 2 matches, 0 gaps T C A T G | |C A T T G 3 matches (2 end gaps) T C A T G . | | | . C A T T G 4 matches, 1 insertion T C A - T G | | | | . C A T T G 4 matches, 1 insertion T C A T - G | | | | . C A T T G Aligning Text Strings
Dynamic Programming • Needleman-Wunsch (1970) provided first automatic method for sequence alignment • Dynamic Programming to Find “Best” Global Alignment • Test Data • ABCNYRQCLCRPMAYCYNRCKCRBP
Step 1 -- Make a Similarity Matrix (Match Scores Determined by Identity Matrix) Put 1's where characters are identical.
Step 2 -- Start Computing the Sum Matrix new_value_cell(R,C) <= cell(R,C) { Old value, either 1 or 0 } + Max[ cell (R+1, C+1), { Diagonally Down, no gaps } cells(R+1, C+2 to C_max),{ Down a row, making col. gap } cells(R+2 to R_max, C+1) { Down a col., making row gap } ]
Step 4 -- Sum Matrix All Done Alignment Score is 8 matches.
Step 5 -- Traceback Find Best Score (8) and Trace BackA B C N Y - R Q C L C R - P MA Y C - Y N R - C K C R B P
Step 6 -- Alternate Tracebacks A B C - N Y R Q C L C R - P MA Y C Y N - R - C K C R B P
Gap Penalties The score at a position can also factor in a penalty for introducing gaps (i. e., not going from i, j to i- 1, j- 1). Gap penalties are often of linear form: GAP = a + bN GAP is the gap penalty a = cost of opening a gap b = cost of extending the gap by one N = length of the gap (e.g. assume b=0, a=1/2, so GAP = 1/2 regardless of length.)
Step 2 -- Computing the Sum Matrix with Gaps new_value_cell(R,C) <= cell(R,C) { Old value, either 1 or 0 } + Max[ cell (R+1, C+1), { Diagonally Down, no gaps } cells(R+1, C+2 to C_max) - GAP ,{ Down a row, making col. gap } cells(R+2 to R_max, C+1) - GAP { Down a col., making row gap } ] GAP =1/2 1.5
ACSQRP--LRV-SH RSENCVA-SNKPQLVKLMTH VKDFCV ACSQRP--LRV-SH -R SENCVA-SNKPQLVKLMTH VK DFCV Key Idea in Dynamic Programming • The best alignment that ends at a given pair of positions (i and j) in the 2 sequences is the score of the best alignment previous to this position PLUS the score for aligning those two positions. • An Example Below • Aligning R to K does not affect alignment of previous N-terminal residues. Once this is done it is fixed. Then go on to align D to E. • How could this be violated? Aligning R to K changes best alignment in box.
Substitution Matrices • Count number of amino acid identities (or non-identities) • Count the minimum number of mutations in the DNA needed to account for the non-identical pairs • Measure of similarity based on frequency of mutations observed in homologous protein sequences • Measure similarity based on physical properties
Similarity (Substitution) Matrix A R N D C Q E G H I L K M F P S T W Y V A 4 -1 -2 -2 0 -1 -1 0 -2 -1 -1 -1 -1 -2 -1 1 0 -3 -2 0 R -1 5 0 -2 -3 1 0 -2 0 -3 -2 2 -1 -3 -2 -1 -1 -3 -2 -3 N -2 0 6 1 -3 0 0 0 1 -3 -3 0 -2 -3 -2 1 0 -4 -2 -3 D -2 -2 1 6 -3 0 2 -1 -1 -3 -4 -1 -3 -3 -1 0 -1 -4 -3 -3 C 0 -3 -3 -3 8 -3 -4 -3 -3 -1 -1 -3 -1 -2 -3 -1 -1 -2 -2 -1 Q -1 1 0 0 -3 5 2 -2 0 -3 -2 1 0 -3 -1 0 -1 -2 -1 -2 E -1 0 0 2 -4 2 5 -2 0 -3 -3 1 -2 -3 -1 0 -1 -3 -2 -2 G 0 -2 0 -1 -3 -2 -2 6 -2 -4 -4 -2 -3 -3 -2 0 -2 -2 -3 -3 H -2 0 1 -1 -3 0 0 -2 7 -3 -3 -1 -2 -1 -2 -1 -2 -2 2 -3 I -1 -3 -3 -3 -1 -3 -3 -4 -3 4 2 -3 1 0 -3 -2 -1 -3 -1 3 L -1 -2 -3 -4 -1 -2 -3 -4 -3 2 4 -2 2 0 -3 -2 -1 -2 -1 1 K -1 2 0 -1 -3 1 1 -2 -1 -3 -2 5 -1 -3 -1 0 -1 -3 -2 -2 M -1 -1 -2 -3 -1 0 -2 -3 -2 1 2 -1 5 0 -2 -1 -1 -1 -1 1 F -2 -3 -3 -3 -2 -3 -3 -3 -1 0 0 -3 0 6 -4 -2 -2 1 3 -1 P -1 -2 -2 -1 -3 -1 -1 -2 -2 -3 -3 -1 -2 -4 6 -1 -1 -4 -3 -2 S 1 -1 1 0 -1 0 0 0 -1 -2 -2 0 -1 -2 -1 4 1 -3 -2 -2 T 0 -1 0 -1 -1 -1 -1 -2 -2 -1 -1 -1 -1 -2 -1 1 5 -2 -2 0 W -3 -3 -4 -4 -2 -2 -3 -2 -2 -3 -2 -3 -1 1 -4 -3 -2 10 2 -3 Y -2 -2 -2 -3 -2 -1 -2 -3 2 -1 -1 -2 -1 3 -3 -2 -2 2 6 -1 V 0 -3 -3 -3 -1 -2 -2 -3 -3 3 1 -2 1 -1 -2 -2 0 -3 -1 4 • Identity Matrix • Match L with L => 1Match L with D => 0Match L with V => 0?? • S(aa-1,aa-2) • Match L with L => 1Match L with D => 0Match L with V => .5 • Number of Common Ones • PAM • Blossum • Gonnet
+ —> More likely than random 0 —> At random base rate - —> Less likely than random Where do matrices come from? • Manually align protein structures(or, more risky, sequences) 2 Look at frequency of a.a. substitutionsat structurally constant sites. -- i.e. pair i - j exchanges 3 Compute log-odds S(aa-1,aa-2) = log2 ( freq(O) / freq(E) ) O = observed exchanges, E = expected exchanges • odds = freq(observed) / freq(expected) • Sij = log odds • freq(expected) = f(i)*f(j) = is the chance of getting amino acid i in a column and then having it change to j • e.g. A-R pair observed only a tenth as often as expected 90% AAVLL… AAVQI… AVVQL… ASVLL… 45%
1978 1991 L 0.085 0.091 A 0.087 0.077 G 0.089 0.074 S 0.070 0.069 V 0.065 0.066 E 0.050 0.062 T 0.058 0.059 K 0.081 0.059 I 0.037 0.053 D 0.047 0.052 R 0.041 0.051 P 0.051 0.051 N 0.040 0.043 Q 0.038 0.041 F 0.040 0.040 Y 0.030 0.032 M 0.015 0.024 H 0.034 0.023 C 0.033 0.020 W 0.010 0.014 Amino Acid Frequencies of Occurrence
Different Matrices are Appropriate at Different Evolutionary Distances (Adapted from D Brutlag, Stanford)
PAM-250 (distant) Change in Matrix with Ev. Dist. PAM-78 (Adapted from D Brutlag, Stanford)
Are the evolutionary rates uniform over the whole of the protein sequence? (No.) The BLOSUM matrices: Henikoff & Henikoff (Henikoff, S. & Henikoff J.G. (1992) PNAS89:10915-10919) . Use blocks of sequence fragments from different protein families which can be aligned without the introduction of gaps. Amino acid pair frequencies can be compiled from these blocks Different evolutionary distances are incorporated into this scheme with a clustering procedure: two sequences that are identical to each other for more than a certain threshold of positions are clustered. More sequences are added to the cluster if they are identical to any sequence already in the cluster at the same level. All sequences within a cluster are then simply averaged. (A consequence of this clustering is that the contribution of closely related sequences to the frequency table is reduced, if the identity requirement is reduced. ) This leads to a series of matrices, analogous to the PAM series of matrices. BLOSUM80: derived at the 80% identity level. The BLOSUM Matrices BLOSUM62 is the BLAST default
Blast against Structural Genomic Target Registry (TargetDB) or against latest PDB or PDB-on-hold listings