Download
1 / 34
350 likes | 449 Views
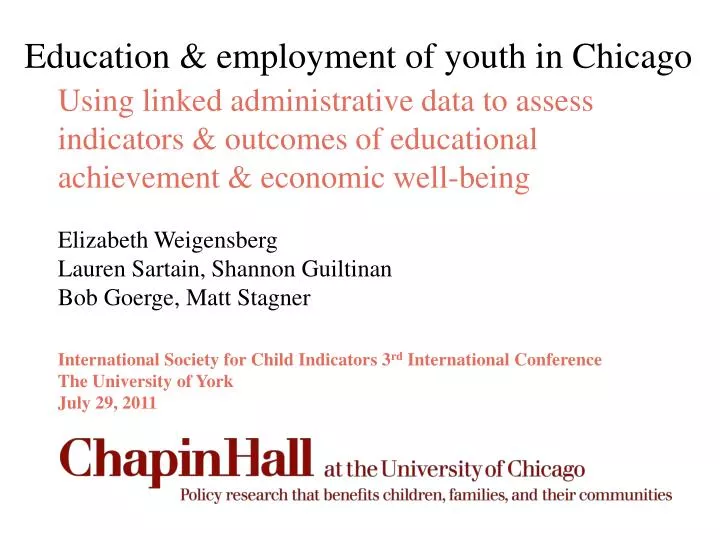
Education & employment of youth in Chicago . Elizabeth Weigensberg Lauren Sartain , Shannon Guiltinan Bob Goerge , Matt Stagner. Using linked administrative data to assess indicators & outcomes of educational achievement & economic well-being.

E N D
Education & employment of youth in Chicago Elizabeth Weigensberg Lauren Sartain, Shannon Guiltinan Bob Goerge, Matt Stagner Using linked administrative data to assess indicators & outcomes of educational achievement & economic well-being International Society for Child Indicators 3rd International Conference The University of York July 29, 2011
Overview • Context of Chicago • Chapin Hall research & data linking initiative • Research objective • Data, methods & sample description • Results • Conclusions & implications
Context of Chicago Data sources: American Community Survey 2009; Census 2008 County Business Patters; 2010 Illinois Dept of Employment Security 3rd largest city in U.S. Population: 3 million in City of Chicago 9.5 million in Chicagoland area Largest industries (based on employment): Healthcare/Social assistance Retail trade Manufacturing Poverty rate: 18% Overall unemployment rate in 2010: 10.6%
Context: Educational attainment in Chicago (ages 25 and older) • 42.9% have high school degree or less; 38% have post-secondary degree • By 2018, 64% of jobs in IL will require post-secondary degree Data source: American Community Survey 2009
Chapin Hall workforce development research & data linking initiative • Partner with local & state agencies to collect, analyze & disseminate information on the performance of Chicago workforce development programs • Innovative data linking across diverse, fragmented public agency administrative data • Conducts research to help answer key workforce policy questions to inform stakeholders: • Chicago Workforce Investment Council • Workforce policymakers and program administrators • Community based workforce program providers • Foundations supporting workforce programs • Other workforce stakeholders, including businesses and residents
Research objective • Objective is to describe characteristics, pathways/experiences, and outcomes of youth in education and workforce development system • Positive education and employment outcomes • Education attainment: high school degree, post-secondary enrollment, persistence • Employment outcomes: participation/completion of workforce development programs, employment, job retention, increase in wages
Data & Methods • Methods • Cohort analysis of first-time Chicago Public School (CPS) freshman (9th graders) in 2000 • Follow youth through high school into workforce & post-secondary education: • CPS Career & Technical Education (CTE) • Workforce Investment Act (WIA) participation • Post-Secondary education enrollment & persistence • Employment & earnings • Data used in administrative data linking • CPS student transcript, dropout & graduation data • National Student Clearinghouse post-secondary data • Workforce Investment Act (WIA) program data • IL Dept of Employment Security quarterly wage data
Traditional education to employment pathway Timeline: 2000 -----------------2004------------------------------------------------------2009/2010 Career & Technical Education WIA youth (in-school youth ages 14-19) WIA youth (out-of-school youth ages 20-21) WIA adults/dislocated workers
Sample • Sample • Cohort of entering 9th grade Chicago Public School (CPS) students in 2000 (n=29,578) • Subsamples: • Students in cohort taking Career & Technical Education (CTE) n=8,513 (28.8%) • Students in cohort also enrolled in WIA in-school youth workforce programs n=2,165 (7.3%) • Subgroup of cohort (those in CPS in 8th grade & graduate high school) to assess post-secondary education outcomes n=12,450 (42.1%) Note: All results shown in presentation are preliminary. Please do not cite or disseminate.
Chicago Public Schools Overview • Large urban district • 486 elementary schools (PreKindergarden – 8th grade) • 122 high schools (secondary school) (grades 9-12) • 413,953 active students • 21,320 teachers • In 1988, called the worst schools in the United States • Recent focus on reforming high schools, career & technical education (CTE) & increasing graduation rates
CPS student demographics:Focus Cohort of 9th grade students in Fall 2000 N=29,578 freshman cohort students
Trajectories for Focus Cohort of CPS 9th graders: High School Completion & Employment
Wage outcomes for Focus Cohort of CPS 9th graders: Average Quarterly Wages of Those Employed • 53-55% of high school graduates & • 28-32% of drop-outs • had employment during quarter
Focus Cohortsubgroup of high school graduates:College/Post-Seconardy Enrollment & Persistence • Overall 67% of the subgroup of high school graduates enrolled in post-secondary education, with 32% persisting (enrolled in college for 8 months in first year and returning for second consecutive year) N= 12,450 student subgroup of graduates
Career and Technical Education: Chicago Public School In-School Workforce Development
Career and Technical Education (CTE) • Workforce development program in high schools • A three-year course sequence (10th-12th grades) in programs such as: • Agriculture • Business and Finance • Health Science • Information Technology • Revamped to be more rigorous in recent years & minimize stigma
CPS student demographics: Focus Cohort & CTE N=29,578 freshman cohort students N=8,513 CTE students
Trajectories for CTE students in Focus Cohort: High School Completion & Employment
Wage outcomes for CTE students in Focus Cohort : Average Quarterly Wages of Those Employed
CTE & Focus Cohortsubgroup of high school graduates: College Enrollment & Persistence • Overall 66% of CTE high school graduates enrolled in post-secondary education, with 32% persisting (enrolled in college for 8 months in first year and returning for second consecutive year) N= 12,450 students in overall subgroup of graduates N= 5,051 students in subgroup of graduates with CTE
Workforce Investment Act: Workforce development/ job training program
WIA Youth Program To be eligible for the Federally-funded WIA youth program, a person must be between the ages of 14 and 21*, have low income, and have a substantial barrier to employment such as: deficient in basic literacy skills, school dropout, homeless, a runaway or a foster child, pregnant or parenting, an offender, or be an individual who requires additional assistance to complete an educational program, or to secure and hold employment. *Under ARRA, the age for the WIA youth program was expanded to age 24. Services include: • Tutoring, mentoring, study skills training, and instruction leading to completion of secondary school • Alternative school services • Paid and unpaid work experience (such as internships and job shadowing) • Occupational skills training • Leadership development • Supportive services • Guidance counseling • Follow-up services
CPS Cohort Students participating in WIA WIA participants • 2,165 (7.3%) of the focus CPS Cohort students participated in the WIA Youth Program before exiting CPS (exited as graduates, dropouts or left the CPS school system = in-school ) • An additional 657 (2.2%) participated in the WIA Youth Program after they exited CPS (exited as graduates, dropouts or left the CPS school system) • A total of 2,822 (9.5%) of the CPS cohort participated in any WIA youth program • 334 (1.1%) of the focus CPS Cohort participated in the WIA Adult or Dislocated Worker program after exiting CPS (including 59 students who had previously participated in the WIA youth program)
CPS student demographics: Focus Cohort & WIA in-school youth N=29,578 freshman cohort students N=2,165 WIA participants * Youth first enrolled in WIA Youth Program before CPS Exit
Trajectories for WIA in-school youth in Focus Cohort: High School Completion & Employment
Wage outcomes for WIA in-school youth in Focus Cohort: Average Quarterly Wages of Those Employed
WIA & Focus Cohortsubgroup of high school graduates: College Enrollment & Persistence • Overall 71% of WIA high school graduates enrolled in post-secondary education, with 31% persisting (enrolled in college for 8 months in first year and returning for second consecutive year) N= 12,450 students in overall subgroup of graduates N= 1,258 students in subgroup of graduates with in-school WIA youth
Overview of Findings • Students with CTE or WIA experiences had higher high school graduation rates & lower dropout rates • Employment • For graduates, percentages similar across groups • For students who dropout, those with CTE or WIA had higher employment percentages • Wages • Graduates had consistently higher average quarterly wages than dropouts & graduates with post-secondary education had higher wages • Any CTE for graduates had slightly higher wages than graduates without CTE • Post-secondary education • Students in CTE enrolled in post-secondary education at similar percentage to non-CTE students, but students in WIA had slightly higher percentage
Conclusions/Policy Implications • These early descriptive results show students with engagement in workforce development program CTE or WIA have promising positive education & employment outcomes • Highlights the important role of workforce development among youth for positive education outcomes, not just positive employment outcomes • Use of innovative linked data to assess education to employment pathway and outcomes • Develop research and measures using cross-system and longitudinal perspective of youth transitioning to adulthood • Provides policymakers & program administrators with unique look at education & employment outcomes
Limitations & Next Steps/Future Research • Data limitations • Wage data only for IL • NSC data not include all post-secondary education & limited completion data • Current research is descriptive • Need further research to assess relationships to achievement of positive outcomes & related factors (demographics, academic achievement) • Early analysis, still acquiring data • Longer time frame for wage data to assess employment & wage outcomes • Include data from other workforce development & human service programs • Analysis of students with missing data • Identify additional meaningful indicators of successful education/employment outcomes
Thank you! Contact information: Elizabeth Weigensberg, PhD Senior Researcher & CWICstats Coordinator eweigensberg@chapinhall.org