Figure 1
240 likes | 377 Views
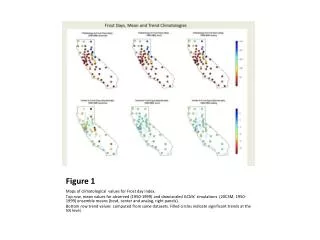
Figure 1. Maps of climatological values for Frost day index. Top row, mean values for observed (1950-1999) and downscaled GCMs ’ simulations (20C3M, 1950-1999) ensemble means ( bcsd , center and analog, right panels).

Figure 1
E N D
Presentation Transcript
Figure 1 Maps of climatological values for Frost day index. Top row, mean values for observed (1950-1999) and downscaled GCMs’ simulations (20C3M, 1950-1999) ensemble means (bcsd, center and analog, right panels). Bottom row trend values computed from same datasets. Filled circles indicate significant trends at the 5% level.
Figure 2 Like Figure 1, for Growing Season Length.
Figure 3 Like Figure 1, for Hot Spells Duration.
Figure 4 Like Figure 1, for Heat Wave Duration.
Figure 5 Like Figure 1, for Warm Nights.
Figure 6 Like Figure 1, for Warm Summer Nights.
Figure 7 Like Figure 1, for Three Warmest Nights.
Figure 8 Like Figure 1, for Consecutive Dry Days.
Figure 9 Like Figure 1, for Precipitation Intensity.
Figure 10 Like Figure 1, for Days with Precipitation greater than 10mm.
Figure 11 Like Figure 1, for Percent Total Precipitation in Very Wet Days.
Figure 12 Like Figure 1, for Maximum 5-day Precipitation.
Figure 13 Trends in Frost Days index (1950-2100) under SRES B1 (left) or SRES A2 (right) computed from downscaled data from BCSD (top) or Analog (bottom). Filled circles indicate significant trends at the 5% level.
Figure 14 Like Figure 13, for Growing Season Length.
Figure 15 Like Figure 13, for Hot Spells Duration.
Figure 16 Like Figure 13, for Heat Wave Duration
Figure 17 Like Figure 13, for Percent Warm Nights.
Figure 18 Like Figure 13, for Percent Warm Summer Nights.
Figure 19 Like Figure 13, for Three Warmest Nights.
Figure 20 Like Figure 13, for Consecutive Dry Days.
Figure 21 Like Figure 13, for Precipitation Intensity.
Figure 22 Like Figure 13, for Days with Precipitation greater than 10mm.
Figure 23 Like Figure 13, for Percent Precipitation in Very Wet Days.
Figure 24 Like Figure 13, for Total 5-day Precipitation.


