Download

1 / 9
90 likes | 132 Views
This study investigates the involvement of MKK6.CA in SN38 resistance in colorectal cancer cells. Drug sensitivity was assessed using the SRB assay, while p38 phosphorylation was evaluated through Western blot analysis. Results show potential resistance mechanisms associated with MKK6.CA expression in SN38 treatment. The study provides insights into potential targets for overcoming drug resistance in cancer therapy.

E N D
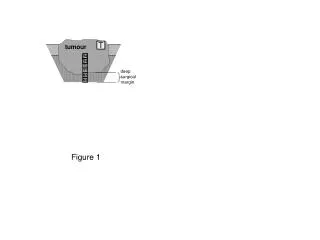
Figure 1 HCT116-s HCT116-SN6 -S -A2 -SN50 -C8 -G7 NT SN38 NT SN38 [SN38] 24H SN38 1µM NT 0.1µM 1µM 5µM 10µM NT 1h 4h 7h 16h 24h 48h A pp38 pp38 HCT116-s HCT116-s tubulin tubulin pp38 pp38 HCT116-SN6 HCT116-SN6 tubulin tubulin B HCT116-SN6 C
HCT116-s HCT116-s p38α p38 b IC50 (nM) 3 p38 g p38δ 2 b-Actin 1 Sh p38 Sh Luc EV p38 CA 0 HCT116-SN6 Luc a b g d p38 CA isoforms p38 Sh RNA p38 Sh RNA p38α p38 b p38 g HCT116-SN6 HCT116-SN6 HCT116-SN6 25 25 16 p38δ 20 20 12 b-Actin 15 15 IC50 (nM) IC50 (nM) Sh p38 IC50 (nM) Sh Luc EV p38 CA 8 10 10 4 5 5 0 0 0 EV a + b EV a b g d Luc a b g d p38 CA isoforms p< 0.05, p< 0.01, p<0.001 Figure 2 A B C D HCT116-s HCT116-s 3 3 2 2 IC50 (nM) IC50 (nM) 1 1 0 0 EV a + b EV a b g d p38 CA isoforms p38 CA isoforms E F G H
10 25 20 2,0 HCT116-SN6 HCT116-s NT 5-FU Oxali 8 20 15 1,5 pp38 6 15 SN38 IC50 (nM) SN38 IC50 (nm) SB IC50 (µM) SB IC50 (µm) 10 1,0 p38 4 10 b-Actin 0,5 5 2 5 0 0,0 0 0 SN38 SB SN38 +SB SN38 SB SN38 +SB SW480 HT29 7 12 14 SW480 HCT116-s HT29 HCT116-SN6 pATF2 6 12 10 4 HCT116-s 5 10 8 4 8 IC50 (nM) IC50 (nM) IC50 (nM) 3 6 3 6 NT SN38 SN38 + SB NT SN38 SN38 + SB 4 IC50 (µM) 2 2 4 HCT116-s 600 1 2 2 1 0 0 0 400 EV p38 a+b p38 a+b EV SN38 SN38+SB 0 IC50 (nM) p38 CA isoforms 5-FU 5-FU+SB p38 CA isoforms 12 200 10 0 8 Oxali Oxali+SB 6 4 2 0 SN38 SN38+SB p< 0.05, p< 0.01, p<0.001 Figure 3 A B D C IC50 (nM) F E
SB202190 Irinotecan 40 mg/ml IP Irinotecan 40 mg/ml IP 0 25 50 75 100 0 5 10 15 20 25 30 Days p< 0.05, p< 0.01, p<0.001 Figure 4 A B C % mice with tumor size doubled
1 4 2 5 3 6 Figure 5 A B C
SW48-SN1 SW48-SN2 SW48-SN3 SW48-SN4 SW48-s pp38 tubulin A B Supplemental Figure 1: p38 is activated by phosphorylation in SN38-resistant SW48 cells. A: Drug sensitivity of the SW48 clones: IC50 values were determined using the SRB assay; the resistance factor was determined by dividing the IC50 value of each resistant clone by that of the sensitive clone SW48-s. Data represent the mean ±SD of at least 3 independent experiments. B: Western blot analysis of p38 phosphorylation in SW48-s cells and in the SN38 resistant clones SW48-SN1, SW48-SN2, SW48-SN3, SW48-SN4.
HCT116-s MKK6 CA EV 4 WB FLAG HCT116 3 2 IC50 (nM) pp38 WB 1 WB p38 0 EV MKK6 CA WB tubulin 8 SW480 SW480 7 6 EV MKK6 CA 5 Clone 1 Clone 2 4 IC50 (nM) 3 WB FLAG 2 1 0 EV MKK6 CA Clone 1 MKK6 CA Clone 2 pATF2 KA A B C D Supplemental Figure 2: Analysis of the involvement of MKK6 CA in SN38 resistance. A: Western blot analysis of HCT116 cells that express constitutively active (CA) MKK6 (or EV, as a control). MKK6 overexpression was detected with anti-FLAG antibody. p38 expression and activation were detected with anti-p38 and anti-phospho-p38 antibodies respectively. Equal loading is shown by tubulin expression. B: SRB assay on HCT116 expressing MKK6 CA or EV as control, and treated with SN38. C: Western blot analysis of 2 clones of SW480 cells that stably express constitutively active (CA) MKK6 (or EV, as a control). MKK6 overexpression was detected with anti-FLAG antibody. p38 activation was detected using a kinase assay to test p38a activity in the 2 clones stably expressing MKK6 CA or Empty Vector as a control. D: SRB assay on SW480 expressing MKK6 CA or EV as control, and treated with SN38.
shLuc Shp38α pMSCV pMSCVp38β shLuc Shp38α pMSCV pMSCVp38β HCT116-s HCT116-SN6 HCT116-SN6 SN38 treated samples pMSCV p38 b 140 NT 120 100 80 ICE arbitrary units 60 Topo I 40 Sn38 1µM 20 0 pMSCV p38 b 1.3 1.2 1.6 2.3 1.3 1.5 1.7 2.5 HCT116-SN6 SN38 treated samples 140 120 100 80 ICE arbitrary units HCT116-s HCT116-SN6 60 Sh Luc Shp38 a Sh Luc Shp38 a 40 20 0 NT ShLuc Shp38a ShLuc Shp38a HCT116-s HCT116-SN6 Sn38 1µM C A b-actin B Supplemental Figure 3: Analysis of Topoisomerase I expression and activity. A: Western blot analysis of Topoisomerase I (TopoI) in HCT116-s-ShLuc, HCT116-s-Shp38a, HCT116-s-pMSCV and HCT116-s-CAp38b cells and in HCT116-SN6-ShLuc, HCT116-SN6-Shp38a, HCT116-SN6-pMSCV and HCT116-SN6-CAp38b cells. Equal loading is shown by b-Actin expression. Numbers underneath the b-actin panel are the quantification data for total TopoI level obtained from western blot analysis after normalization to β-actin. B: Quantification ofSN38-induced TopoI-DNA complexes using the ICE bioassay and nuclear extracts from HCT-116-s-ShLuc and -Shp38a cells and HCT116-SN6-ShLuc and -Shp38a cells. The relative intensity of the immune complexes in SN38-treated cells was normalized to that of untreated cells. C: Quantification ofSN38-induced TopoI-DNA complexes using the ICE assay and nuclear extracts from HCT116-SN6-pMSCV and -CAp38b cells. The relative intensity of the immune complexes in SN38-treated cells was normalized to that of untreated cells.
600 600 500 500 400 Tumor size (mm3) Tumor size (mm3) Tumor size (mm3) 300 400 1 2 3 4 5 6 7 8 Sh p38 a Sh Luc 200 HCT116-SN6 pMSCV 300 HCT116-SN6 p38 b 100 HCT116-SN6 pMSCV 200 HCT116-SN6 p38 b CA 0 Days 0 5 10 15 20 25 HCT116-SN6 Sh Luc Days Days 100 HCT116-SN6 Sh p38 a Irinotecan 40 mg/ml IP Irinotecan 40 mg/ml IP 0 0 5 10 15 25 E 20 p38 b b-actin p38 a 600 1 2 3 4 5 6 7 8 p38 beta b-actin pMSCV 500 400 HCT116-SN6 Sh Luc p38 a /b-actin 300 HCT116-SN6 Sh p38 a 60 Arbitrary units 50 200 40 30 100 20 10 0 0 0 5 10 15 20 25 Sh p38 alpha Sh Luc HCT116-SN6 A B C D Supplemental Figure 4: Thedifferential expression of the four p38 isoforms influences the response to irinotecan. A: Tumor growth kinetics in mice xenografted with HCT116-SN6- pMSCV or HCT116-SN6-p38b, HCT116-SN6-ShLuc or HCT116-SN6-Shp38a cells before irinotecan treatment. B: Tumor growth kinetics in mice xenografted with HCT116-SN6-ShLuc or HCT116-SN6-Shp38a cells and treated with irinotecan. C: Tumor growth kinetics in mice xenografted with HCT116-SN6-pMSCV or HCT116-SN6-p38b cells and treated with irinotecan. D: Western blot analysis of p38b expression in HCT116-SN6-pMSCV and HCT116-SN6-CA38b xenografts. Equal loading is shown using b-Actin. E: Western blot analysis of p38a expression in HCT116-SN6-ShLuc or HCT116-SN6-Shp38a xenografts. Equal loading is shown using b-Actin. Histogram shows the quantification data for p38a level obtained from western blot analysis after normalization to β-actin.