Download
1 / 14
140 likes | 216 Views
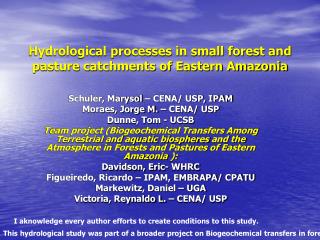
Seasonality of water and heat fluxes over a tropical forest in eastern Amazonia. Humberto R. da Rocha*, Leandro D.V.O. Pinto, Helber C. Freitas, Adelaine M.S.Figueira Department of Atmospheric Sciences, IAG/University of Sao Paulo Michael L. Goulden, Scott D. Miller, Mary C. Menton

E N D
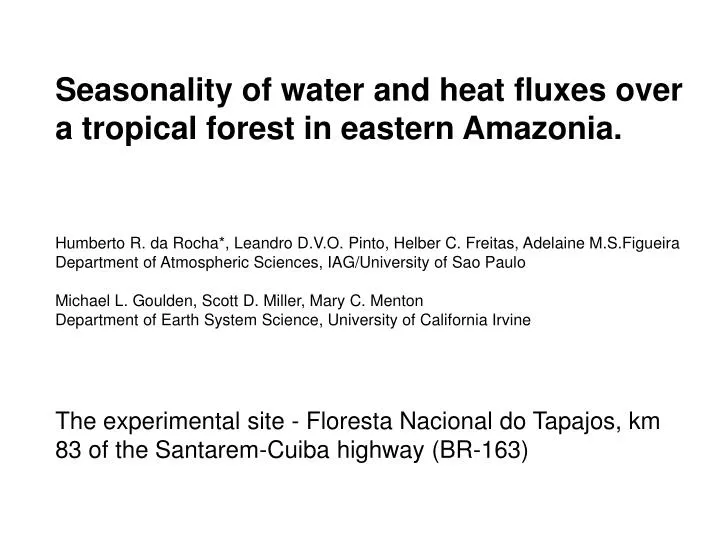
Seasonality of water and heat fluxes over a tropical forest in eastern Amazonia. Humberto R. da Rocha*, Leandro D.V.O. Pinto, Helber C. Freitas, Adelaine M.S.Figueira Department of Atmospheric Sciences, IAG/University of Sao Paulo Michael L. Goulden, Scott D. Miller, Mary C. Menton Department of Earth System Science, University of California Irvine The experimental site - Floresta Nacional do Tapajos, km 83 of the Santarem-Cuiba highway (BR-163)
Energy balance • energy stored in the canopy 0.0 to 0.15 MJm-2day-1 • biomass storage, 0.1 MJm-2day-1 larger in absolute values • The seasonality of storage terms appear similar to the variation of air temperature daily amplitude, that is, decreasing in wet season and increasing towards the dry season. • fluxes underestimate the available energy by 22% (Y=0.78x+4.29, R20.86,N=7943 • the closure’s deviation was 22%, and when including those therms, it decreased to 21%. • Conductances of water vapour
Significant differences Dry season Wet season All year E (mm day-1) 3.7 0.6 2.8 0.9 3.2 0.8 Rn (MJm-2day-1) 12.8 1.9 10.1 2.6 11.4 2.5 H (MJm-2day-1) 2.3 0.8 2.1 0.9 2.2 0.9 Bowen ratio 0.33 0.09 0.41 0.10 0.37 0.11 Dry to wetseason Wet to dry season Bowen ratio 0.28 0.10 0.40 0.10 H (MJm-2day-1) 1,8 0.7 2.4 0.9 Table 1. Average daily rates and standard deviation of evaporation (E), net radiation (Rn), sensible heat flux (H) and Bowen ratio, in the dry and wet season, in the entire period and in transition periods (see text for periods specification).