Download
1 / 43
430 likes | 453 Views
This report covers 2014 sales results, customer savings, category reviews, and future initiatives of the DeCA Perishable Team focusing on Produce, Meat, Deli/Bakery/Seafood, and Dairy. Learn about promotional planning, new item schedules, and industry partnerships.

E N D
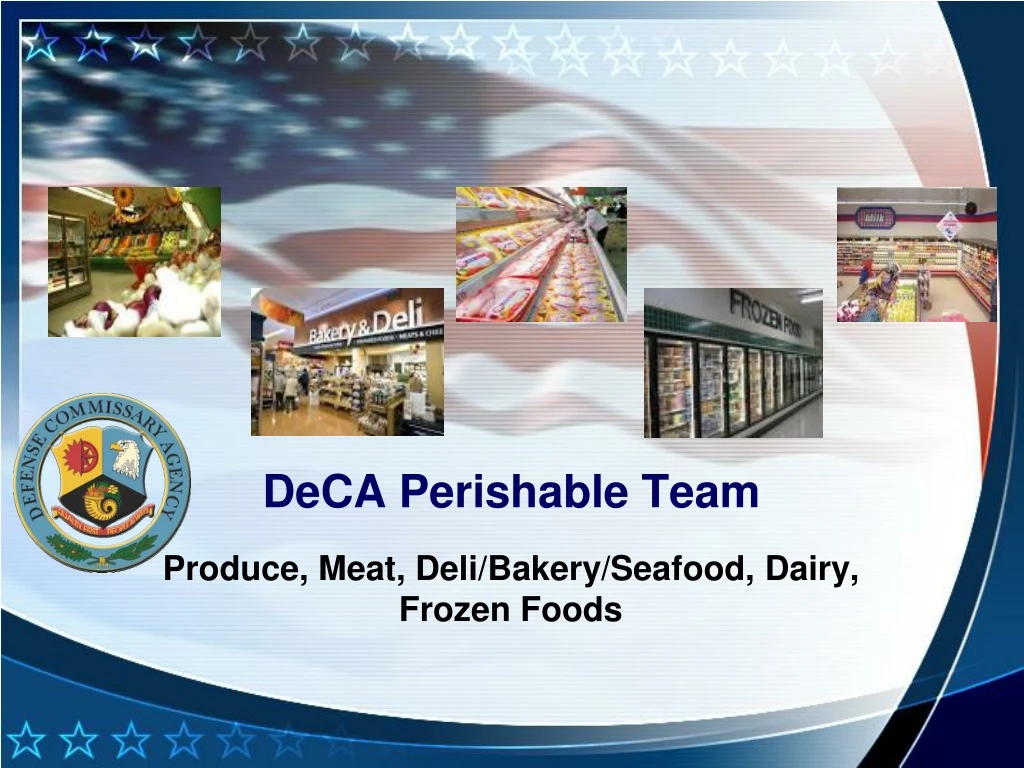
DeCA Perishable Team Produce, Meat, Deli/Bakery/Seafood, Dairy, Frozen Foods
DeCA Perishable Team • BRIDGET BENNETT – PRODUCE • NORM APT – MEAT • DAVE LEFFERT – DELI/BAKERY/SEAFOOD • STEVE VILLENEUVE – DAIRY • RICHARD WALKER – FROZEN
DeCA Perishable Team DISCUSSION TOPICS • 2014 SALES RESULTS • CUSTOMER SAVINGS BY CATEGORY • CATEGORY REVIEW/NEW ITEM SCHEDULE • PROMOTIONAL PLANNING/EXECUTION • FUTURE INITIATIVES
DeCA PERISHABLE TEAM $250.9M -2.74% DOLLARS BUSINESS OBJECTS 26 WEEKS END 2/28/14 PRODUCE 2014 SALES RESULTS
DeCA PERISHABLE TEAM CATEGORY$ VOL$CHG vs YAGUNIT VOLUNIT CHG vs YAG PREM JUICE $ 5.79M 4.03% 2.67M 2.88% SALAD $17.63M -2.81% 7.24M -4.44% NUTS $ 2.83M 83.51% 448K 97.82% BUSINESS OBJECTS 26 WEEKS ENDING 2/28/14 PRODUCE/NAME BRAND 2014 SALES RESULTS
DeCA PERISHABLE TEAM CUSTOMER SAVINGS BY CATEGORY CATEGORYSAVINGS 1 – PREMIUM JUICE 25.81% 2 – SALAD 21.05% 3 – NUTS 18.63% NIELSEN 26 WEEKS END 3/1/2014 PRODUCE
DeCA PERISHABLE TEAM 2014 SALES RESULTS $13.2M +11% DOLLARS BUSINESS OBJECTS 26 WEEKS END 2/28/14 GROCERY ITEMS MERCHANDISED IN PRODUCE
DeCA PERISHABLE TEAM 2014 SALES RESULTS CATEGORY$ VOL$CHG vs YAG UNIT VOLUNIT CHG vs YAG TRAIL MIX $5.49M+ 2.47 1.52M + 8.48 DIPS $1.58M + 80.60 646K +60.75 CUT FRUIT $1.25M+ 3.52 706K -9.71 MISC. DRY $1.23M + 9.80 891K +11.11 SALAD DRESS. $755K + 37.70 252K +40.76 BUSINESS OBJECTS 26 WEEKS ENDING 2/28/14 GROCERY ITEMS MERCHANDISED IN PRODUCE
DeCA PERISHABLE TEAM CATEGORYSAVINGS 1 ‒ TRAIL MIX TYPE 27.2% 2 – DIPS 25.5% 3 ‒ JAR FRUIT 26.1% 4 ‒ MISC. DRY 24.8% 5 ‒ SALAD DRESSING 18.4% NIELSEN 26 WEEKS END 3/31/14 GROCERY ITEMS CUSTOMER SAVINGS BY CATEGORY
DeCA PERISHABLE TEAM • Changes provided to Industry for review and rebuttals/business cases by the COB 5th working day • All rebuttals answered and provided to Industry with final decisions • Brand leaders gathered for planogram development to determine available space for new innovation • Make product decisions and notify Industry of results • Partner with Industry to develop final planograms and reset schedules (timeline 60 days) CATEGORY REVIEWS
DeCA PERISHABLE TEAM Month of PresentationCategories AprilDips JulySpices, Herbs September Packaged Peanuts November Salad Toppers PRODUCE NEW ITEM SCHEDULE
DeCA PERISHABLE TEAM • Right mix of products on displays – EDLP/High Low • Focus on One-Time Buys – Treasure Hunts • Formalize Cross Merchandising Efforts PRODUCE PROMOTIONAL PLANNING/EXECUTION
DeCA PERISHABLE TEAM • Partner with Meat and Grocery for Themed Displays • Partner with Industry Members to Enhance Sales • Standardize PLU Codes with Industry Standards • Commodity Code Review and Modification PRODUCE FUTURE INITIATIVES
DeCA PERISHABLE TEAM • Sales from Sep 2013 to Feb 2014 • Deli/Bakery Sales ‒ $94.9M • -2.5% vs year ago • Flat in FY 2013 - first year of no growth • $196M in total sales NIELSEN 26 WEEKS END 3/1/2014 DELI AND BAKERY
DeCA PERISHABLE TEAM • Deli sales $43.9M - 3.3% • Bakery sales $20.3M - 8% • Hot Food sales $4.5M - 4.7% • Sushi sales $10.5M - 2.7% NIELSEN 26 WEEKS END 3/1/2014 Deli/Bakery by Segments
DeCA PERISHABLE TEAM • OPPORTUNITIES • Perishables/perimeter driving growth in retail • Customers seeking convenience and value • Rotisserie chicken • Sandwiches (custom made) • Sushi • Healthy foods are important and deli answers those needs • Tie-in with other departments • Become part of the store operation NIELSEN 26 WEEKS END 3/1/2014
DeCA PERISHABLE TEAM NIELSEN 26 WEEKS END 3/1/2014 SEAFOOD SALES • FYTD Total Seafood $9.7M: 7.36% vs. year ago • Seafood Market: $7.2M • Tray Pack: $1.2M • Road Shows: $1.3M • Total Seafood FY 2013: $20.7M
DeCA PERISHABLE TEAM SEAFOOD OPPORTUNITIES • Stores in NC, SC, and GA lost tray pack suppliers in FY 2013. In the process of getting new contracts in those stores ‒ projected sales of $1.1M • Seafood markets at two large stores coming on line in FY 2014 ‒ projected sales of $850K • Getting Texas stores back in line with tray pack sales will bring about projected sales of $327K
DeCA PERISHABLE TEAM FRESH MEATS $174,604,171 -3.30% Dollars PRE-PACKED CHILLED MEATS $96,945,958 -0.94% Dollars POULTRY FRESH (Chicken, Turkey, Cornish Hens) $50,846,679 +1.26% Dollars NIELSEN 26 WEEKS END 3/1/2014 2014 Sales Results
DeCA PERISHABLE TEAM THESE TOP 6 CATEGORIES PROVIDE OVER 90% OF TOTAL PRE-PACKAGED CHILLED MEAT NIELSEN 26 WEEKS END 3/1/2014 2014 SALES RESULTS PRE-PACKAGED CHILLED MEAT
DeCA PERISHABLE TEAM CATEGORYSAVINGS BREAKFAST 33.3% LUNCHMEAT 30.1% DINNER SAUSAGE 30.0% FRANKS 31.2% MEAL COMBOS 32.9% NIELSEN 26 WEEKS END 2/21/2013 PRE-PACKED CHILLED MEAT CUSTOMER SAVINGS BY CATEGORY
DeCA PERISHABLE TEAM MAY 6-16 HOLIDAY HAMS SEAFOOD/PICKLES/ DELI SALAD JUNE 9-16 LUNCHMEAT/MEAL COMBOS/STRIPS CUTS SEPTEMBER 8-19 DINNER SAUSAGE/FRANKS New items “new to retail” may be presented at any time during the year. Goal is to make 1st ships at the same times items are hitting the shelf in remaining markets. 2014 CATEGORY REVIEWS/NEW ITEM PRESENTATION
DeCA PERISHABLE TEAM • Random weight items must be offered pre-priced case ready! • Create appealing displays (coffins or upright mobile merchandisers) • Looking for manufacturer/broker themed events offering competition between stores for execution and sales growth regardless of store size • Coupon, recipes, and demo tie-ins to create excitement • Signage with patron savings call outs FRESH & CHILLED PRE-PACKAGED MEAT PROMOTIONAL PLANNING/EXECUTION
DeCA PERISHABLE TEAM • Create a snack section within the lunchmeat to bring in millenniums to the category • Standardize PLU codes to Industry standard • Commodity code review and modification • Reduce mandatory stock assortment for fresh meats; evaluation and adjustments made by performance • Partners with suppliers to enhance sales • Re-evaluate space to sales by performance FRESH & CHILLED PRE-PACKAGED MEAT FUTURE INITIATIVES
DeCA PERISHABLE TEAM NIELSEN 26 WEEKS END 3/29/2014 DAIRY 2014 SALES RESULTS $215,168,313 -6.0% Dollars
DeCA PERISHABLE TEAM DAIRY 2014 SALES RESULTS THESE TOP SIX CATEGORIES PROVIDE ABOUT 80% OF TOTAL DAIRY SALES CATEGORY $ VOL $ CHG vs YAG UNIT VOL UNIT CHG vs YAG CHEESE $55,585,436 -4.4% 20,570,773 -8.2% MILK $42,941,123 -7.4% 16,353,682 -11.3% YOGURT $21,540,701 -6.1% 19,185,237 -6.9% EGGS $20,599,586 -1.4% 9,537,749 -7.7% REF JUICE $19,811,595 -9.0% 8,233,510 -5.6% CREAM $11,177,160 -3.1% 4,925,219 -7.9%
DeCA PERISHABLE TEAM CATEGORYSAVINGS CHEESE 33.5% MILK 23.5% YOGURT 24.6% JUICE/DRINKS 26.2% EGGS 25.3% CREAM 25.4% DAIRY CUSTOMER SAVINGS BY CATEGORY
DeCA PERISHABLE TEAM DAIRY CATEGORY REVIEWS Commence about 30 days prior to new item presentation month Changes provided to Industry for review and rebuttals/business cases by the COB 5th working day Make product decisions and notify Industry of results Rebuttals answered with final decisions Planograms developed to provide space for new and innovative items
DeCA PERISHABLE TEAM DAIRY NEW ITEM SCHEDULE Presentation MonthCategories January Snack/Block Cheese February Sliced/Shred Cheese March Yogurt April Dough/Specialty Eggs May Juice/Tea June Margarine/Butter July Culture/Cream Cheese August Coffee/Creamers/Organic Milk September Yogurt October Deserts/Pasta/Soup November Juice/Tea
DeCA PERISHABLE TEAM • Right mix of products on displays – EDLP/High Low • Create appealing display layouts • Minimize display assortment to ensure adequate pack-out and sales • Follow-up on execution of plans, Industry and stores (COMM-Ex/Display Distributor Fill Rates) • Promotional report card reviewed for lift in dollars and units DAIRY PROMOTIONAL PLANNING/EXECUTION
DeCA PERISHABLE TEAM DAIRY FUTURE INITIATIVES Develop with Industry partners a reset implementation schedule Partner with Industry/Category leaders to enhance sales potential and results Implement changes to re-indexed categories
DeCA PERISHABLE TEAM • FROZEN 2014 SALES RESULTS $179,791,779 -7.8% Dollars NIELSEN 26 WEEKS END 3/1/2014
DeCA PERISHABLE TEAM CATEGORY$ VOL$ CHG vs YAGUNIT VOLUNIT CHG vs YAG Entrees $33,495,311 -12.4% 10,465,546 -16.0% Seafood $17,417,328 2.0% 2,465,456 -8.4% Vegetables $13,931,271 -6.5% 10,605,694 -8.4% Pizza $13,667,306 -9.1% 5,491,714 -14.5% Ice Cream $10,465,427 -8.2% 3,013,975 -10.7% Poultry $10,185,042 -5.2% 2,060,261 -7.3% THESE TOP SIX CATEGORIES PROVIDE OVER 55% OF TOTAL FROZEN SALES NIELSEN 26 WEEKS END 3/29/2014 FROZEN 2014 SALES RESULTS
DeCA PERISHABLE TEAM CATEGORYSAVINGS ENTREES 26.3% PIZZA 21.7% VEGETABLES 38.2% SEAFOOD 23.0% ICE CREAM 16.8% POULTRY 32.7% NIELSEN 26 WEEKS END 3/29/2014 FROZEN CUSTOMER SAVINGS BY CATEGORY
DeCA PERISHABLE TEAM • Commence about 60 days prior to new item presentation month • Changes provided to Industry for review and rebuttals/business cases by the COB 5th working day • All rebuttals answered and provided to Industry with final decisions • Brand leaders gathered for planogram development to determine available space for new innovation • Make product decisions and notify industry of results • Partner with Industry to develop final planograms and reset schedules (timeline 60 days) CATEGORY REVIEWS
DeCA PERISHABLE TEAM Presentation MonthCategories January Ice Cream/Novelties/Toppings FebruarySeafood MarchBreakfast AprilMeats (Excluding Poultry) May Vegetables/Potatoes JuneJuice/Fruit JulyPoultry AugustMeatless SeptemberDesserts/Breads OctoberInternational NovemberSnacks/Pizza DecemberEntrée/Prepared Dinners FROZEN NEW ITEM SCHEDULE
DeCA PERISHABLE TEAM • Right mix of products on displays – EDLP/High Low • Create appealing display layouts • Minimize display assortment to ensure adequate pack-out and sales • Follow-up on Execution of Plans, Industry and stores (COMM-Ex/Display Distributor Fill Rates) • Promotional report card reviewed for lift in dollars and units FROZEN PROMOTIONAL PLANNING/EXECUTION
DeCA PERISHABLE TEAM • Develop/implement reset schedule • Partner with Industry/Category leaders to enhance sales potential and results • Re-index categories • Implement changes FROZEN FUTURE INITIATIVES