Download
1 / 15
150 likes | 246 Views
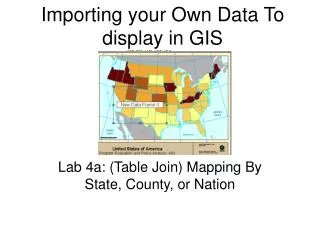
This presentation at the Agricultural Statistics User Conference in July 2013 in Edinburgh outlines the process of integrating JAC and IACS datasets for calculating stocking rates in Scotland. It covers complications, outputs, applications, and future CAP activity measures related to designated sites, water quality, and woodland expansion.

E N D
Mapping Stocking Rates in Scotland: Integrating JAC and IACS data Keith Matthews, Dave Miller, James Sample and Sarah Dunn Agricultural Statistics User Conference, July 2013, Edinburgh
Outline • Datasets • Calculations • Complications • Outputs • Applications • Future CAP Activity Measures • Designated Sites • Water Quality • Woodland Expansion
Datasets • IACS • SG-RPID dataset derived from SAF forms - claims • >5M ha coverage in 2009, increasing • Linked to field mapping (GIS) • Land use, ownership, rentals etc. • JAC • Livestock numbers (and several other items for related projects) • Other datasets • Common Grazings – beyond those in IACS • National Forest Inventory (decadal) • Linkage – holding numbers, FID-Holding-BRN
SR Calculation • Forage area – land use classification (IACS crop codes) • Livestock numbers – simplified classes – cattle, sheep and deer • Conversion to livestock units (LSU) – weightings • Cow-calf = 1.0 • Ewe-lamb = 0.12 • Deer = 0.3 • Simplification – JAC will support much more detailed calculations – see SAC Farm Management Handbook • SR = LSU/Forage Area
Complications & Compromises • IACS + JAC • JAC (LU and Stock)+ IACS • Crofters + JAC – shares, apportionments and in-bye • JAC + JAC - not mapped – some limits on rentals data, type not specified.
Rental Issues • Rentals only accounted for in seasonal SAF sheets • Business not holding • But - mismatch ~150,000 ha - rental-in by non IACS – no matching record for the rental-out • Rental-in only specified as business not holding (issue when multi-holding business – which livestock to associate) • In raw IACS data some coding issues, e.g. claims for all area even though renting records exist. Rules based clean up, limiting to GIS areas, rental-in prioritised as most reliable.
Limitations • Business level • Single date • Averages over all grazing land – mixed businesses particularly challenging – e.g. SW dairy and Highland sheep in separate holdings • Other factors may mitigate or exacerbate any consequences of stocking – e.g. availability of housing
Outputs • National SR map • Regional or sectoralbreakdowns • Relationships with other variables
Future CAP: Activity Requirements • Example of an SR base activity requirement • SR value was 0.12 lsu/ha • Used scale-back from Pack Inquiry not the guillotine of the agreed regulation • Significant effects
Designated Areas • Discussion of activity measures for Pillar 1 CAP and Areas of Natural Constraint in Pillar 2 • Range of SRs for combinations of designations • Unmapped area significant
Water Quality: Nitrates Directive Review • SR estimates spatial distribution of manure production • IACS data used to infer application rates of inorganic fertilisers • Used as inputs to a spatially distributed nitrate leaching model (NIRAMS II) • Map surface and groundwater monitoring as one strand of evidence in the 2013 Nitrates Directive review
Woodland Expansion Advisory Group • 10,000 ha per annum afforestation aspiration • Consequences for livestock numbers • Regional and land capability break-downof SR areas
Conclusions • Feasible – useful despite some limits • Improvements – a move to holding basis would eliminate cross-holding averages – rentals issues can be solved • New cattle movement datasets from CTS now underpin JAC so more sophistication possible here • Move beyond SR – lifecycle of livestock within EPIC exposure to environments and linkage to disease • Future CAP activity criteria – if SR based, then a far more rigorous set of calculations will be needed
Contacts • Dr Keith MatthewsThe James Hutton InstituteCraigiebuckler, AberdeenEmail: keith.matthews@hutton.ac.ukWeb: http://www.hutton.ac.uk/staff/keith-matthews • Dr James SampleEmail: james.sample@hutton.ac.ukWeb: http://www.hutton.ac.uk/staff/james-sample