Download
1 / 25
250 likes | 357 Views
Evaluation of Potential ITS Strategies under Non-recurrent Congestion Using Microscopic Simulation. Lianyu Chu, University of California, Irvine Henry Liu, Utah State University Will Recker, University of California, Irvine. Introduction. Microscopic simulation

E N D
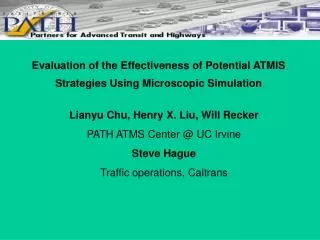
Evaluation of Potential ITS Strategies under Non-recurrent Congestion Using Microscopic Simulation Lianyu Chu, University of California, Irvine Henry Liu, Utah State University Will Recker, University of California, Irvine
Introduction • Microscopic simulation • a software tool to model traffic system, including roads, drivers, and vehicles, in fine details. • models:AIMSUN2, CORSIM, MITSIM, PARAMICS, VISSIM… • Why simulation? • Infeasibility / inadequacy of mathematical treatment of traffic processes • answer “why if” questions • Applications • model and Evaluate ITS • calibrate / optimize operational parameters of ITS strategies • develop / test new models, algorithms, control strategies
Objectives • Evaluating ITS • study on how potential ITS strategies can help solve non-recurrent traffic congestion • Involved ITS strategies • incident management • adaptive ramp metering • arterial management • traveler information • integrated control: combination of several ITS components
PARAMICS • PARAMICS: PARAllel MICroscopic Simulation • a suite of software tools for microscopic traffic simulation, including: • Modeller, Analyzer, Processor, Estimator, Programmer • developer: Quadstone, Scotland • Features • large network simulation capability • modeling the emerging ITS infrastructures • Application Programming Interfaces (API) • access core models of the micro-simulator • customize and extend many features of Paramics • model complex ITS strategies
Modeling complex ITS strategy via API Signal API Library from Vendor Ramp ATMIS Modules Routing Demand Developed API Library CORBA Data Handling Databases XML Advanced Algorithms (complex ITS strategies) Adaptive Signal Control Adaptive Ramp Metering Integrated Control Strategy
Study network / Identified problem An shoulder incident on I-405N, at 7:45 NB I-405 is highly congested: 7:30-8:30 AM Irvine, CA
Procedure of evaluation study • Simulation network coding • Calibration of simulation model • Implementation of ITS components / strategies • Simulation runs / getting performance measures from simulation • Data analysis • Evaluation results
Overall model validation / evaluation (I) 5-min traffic count calibration at major freeway measurement locations (Mean Abstract Percentage Error: 5.8% to 8.7%)
Overall model validation / evaluation (II) 3.1% (SB) 8.5% (NB) Comparison of observed and simulated travel time of SB / NB I-405
Implementation of ITS components (I) • Incident and incident management • an incident plug-in with the following parameters • location of the incident • time when the incident happens • incident detection time and response time • incident clearance time • incident management • modifying incident clearance time • Actuated signal control • using the plug-in we previously developed
Implementation of ITS components (II) • Adaptive ramp metering • ALINEA: local adaptive ramp metering • proposed by Papageorgiou, et al. • BOTTLENECK: coordinated adaptive ramp metering • applied in Seattle, Washington • using the plug-in we previously developed • having been calibrated in the target network
Implementation of ITS components (III) • Traveler information systems • all kinds of traveler information systems • using dynamic feedback assignment • instantaneous traffic information is used for traveler’s route choice. • control parameter: compliance rate (familiarity factor) • Arterial management (along diversion routes) • change timing for diverted traffic during incident • off-line optimization using SYNCHRO based on estimated traffic volume • applied in integrated control scenarios (S7 and S8)
Implementation of ITS components (IV) • Integrated control scenarios • Scenario #7: • freeway control + traffic information • Scenario #8: • freeway control + arterial traffic management + traffic information • implements through API programming • Incident detection and response time: 5 minutes, then: • CMS showing messages (for S7 and S8) • adaptive ramp metering using ALINEA (for S7 and S8) • arterial management: using timing under incident (for S8)
Performance measures • MOE #1 system efficiency: • Vehicle Hour Traveled (VHT) • MOE #2 system reliability measure: • average std. of OD travel times over the whole period (Std_ODTT) • MOE #3 freeway efficiency measure • average mainline travel speed during the peak period (peak_AMTS) and the whole period (AMTS) • MOE #4 on-ramp efficiency measure • total on-ramp delay (TOD) • time percentage of the on-ramp queue spillback (POQS) • MOE #5 arterial efficiency measure • average travel time of an arterial (ATT) and its std. (std_ATT)
Determining number of runs Using two MOEs: VHT and AMTS • μ, δ: • mean and std of MOE based on the already conducted simulation runs • ε: allowable error • α: confidence interval
Evaluation results: overall • Simulation period: from 5:45 to 10:00 a.m. • All scenarios were compared with Scenario #1: • no incident management scenario (33 minutes) • overall performance: • all ITS strategies have positive effects • more ITS components, more benefits
Evaluation results: VHT Confidence intervals of VHT differences of any two scenarios* * A higher confidence interval corresponds to a more significant VHT difference of the two scenarios.
Freeway performance (NB I-405) Notes: AMTS – Average mainline travel speed of entire simulation period (6 – 10 AM) peak_AMTS – Average mainline travel speed of congestion period (7:30 – 9:30) TOD – Total on-ramp delay POQS – Time percentage of vehicles on the entrance ramps spillback to the surface streets
Evaluation results: incident management and adaptive ramp metering • Incident management: • incident duration from 33 minutes to 26 minutes • statistically improve VHT at 85% confidence interval • from 33 minutes to 22 minutes • statistically improve VHT at 99% confidence interval • Adaptive ramp metering • ALINEA and BOTTLENECK cannot effectively improve VHT or freeway travel speed. • comparing ALINEA and BOTTLENECK: • BOTTLENECK performs better in terms of VHT • ALINEA performs better in terms of on-ramp MOEs
Evaluation results: traffic information Scenario #6 has the greater benefits than adaptive ramp metering (S4 and S5) improved incident management (S3) Reason for the good performance: network topology In terms of on-ramp performance (TOD and POQS): S6 does not show a good performance • VHT vs. compliance rate • Sensitivity analysis: • 15-20%: VHT saving reaches a stable maximum • 20%: used in S6, S7 and S8.
Evaluation results: integrated control • S7: only freeway agency responds • S8: both freeway and arterial agencies involve. • Compared to S6, • S7 and S8 significantly improved VHT. • Comparing #7 and #8, • VHT: S8 got improved at 97.5% confidence interval. • std_ODTT, AMTS and peak_AMTS: S7 and S8 have comparable performance • TOD and POQS: S8 introduces more on-ramp delays • ATT and std_ATT: S8 introduces shorter arterial delays • S8 shows the best performance • S7’s performance is also good
Discussion: Benefit of ITS during the congestion period Incident is injected at 7:45, S6, S7 and S8 clearly "recovers" faster than S2 No matter what ITS strategies are applied a worst time of congestion always exists • Reasons: • dynamic feedback assignment, based on instantaneous travel time information feedback from simulation • Incident detection and response time • If instantaneous information used for traffic management • a worst time of traffic congestion will not be avoided
Conclusion • Most important ITS component: • traffic information • Adaptive ramp metering: • not effective under incident scenario • Fast incident management: • needs to be applied with other ITS strategies • Proper combination of ITS strategies: • yields greater benefits • Integrated control performs the best