Download
1 / 14
140 likes | 250 Views
This study conducts an evaluation of healthcare coverage efficiency utilizing agent-based simulation to assess the impact of uninsured individuals on public health metrics in the U.S. The simulation analyzes cost, resource utilization, and epidemic duration in relation to the percentage of uninsured agents. Results indicate less statistically significant differences than anticipated, reflecting a complexity in understanding the overall healthcare landscape. Key parameters include hospitalization rates, treatment times, and the interplay between different health insurance models.

E N D
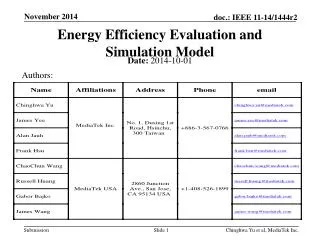
Evaluation of Healthcare Coverage Efficiency Using Agent-Based Simulation Joe Dinius ECE508 15 Oct 2009
Agenda • Introduction • Review of the Literature • Hypotheses • Model Description • Parameters • Results • Sensitivity Analysis • Conclusions
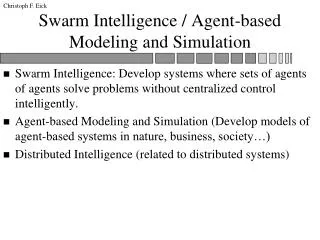
Introduction • Healthcare is a pressing issue in American society • Economic Recovery • Public Welfare • Current public health data is insufficient to evaluate impact to public health impact due to uninsured • Agent-based simulation provides flexible framework for evaluating impact of uninsured to overall public health
Introduction • Parameters of interest will be means and standard deviations of • Cost • Resource Utilization (Hospitalization) • Time for epidemic to end • Agents are simple • Interaction rule is nearest-neighbor disease propagation • Hypothetical disease presented requiring hospitalization (resource utilization)
Review of the Literature • HUS08 publishes average data • Percentage of Americans who are uninsured • Cost of private vs. public insurance • Average results are misleading as not every condition requires treatment • Need data from catastrophic life events requiring hospitalization • Provides comparison between privately insured and uninsured • Other studies completed comparing FFS vs. managed care case studies for pregnant women in California
Hypotheses • Lower percentage of uninsured agents should lead to lower epidemic time • Should be difference in cost structure as number of uninsured agents increases • Non-profit insurance should ensure better care at less net cost
Model Description • One agent is infected at initialization • Random draw for susceptibility of nearest-neighbors is performed and agents are infected accordingly • Agents are hospitalized one day after being infected and social network is broken • Agents are hospitalized until treatment time ends • If released before fully treated, time to be cured of the disease increases by a scale factor
Model Description • After infection occurs, agents’ susceptibility goes to 0 • Simulation runs until number of infected agents is 0
Parameters • Insurance status • Cost • Treatment time • Susceptibility • Cure time • Scale factor for cure time
Results • Refer to paper for statistical tables of output
Conclusions • Less statistically significant differences than expected • Cost • Resource Utilization • Epidemic Duration • Metrics focused on were averaging • Less impact on results from transients • Hypothetical disease model suggests macroscopic view of contemporary healthcare problem is incomplete