Download

1 / 27
270 likes | 413 Views
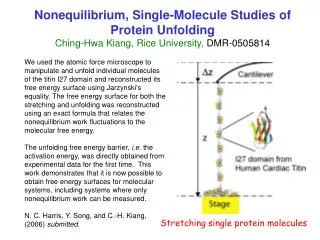
Evaluation of Microscopic Inhomogeneity in Solids Using Single Molecules as Nanometer-sized Probes. Yoko Miyamoto Miyasaka Lab. Contents. I. Introduction Single molecule detection: History and methods Single molecules as nano-probes in evaluating microscopic properties of materials

E N D
Evaluation of Microscopic Inhomogeneity in Solids Using Single Molecules as Nanometer-sized Probes Yoko Miyamoto Miyasaka Lab.
Contents I. IntroductionSingle molecule detection: History and methods Single molecules as nano-probes in evaluating microscopic properties of materials II. Single molecule imaging and its related techniquesWide-field microscopySingle molecule tracking III. Evaluation of polymeric materials with SMIPrevious worksMy current research topic: Development of a multicolor detection system IV. Summary
History of Single Molecule Spectroscopy • 1989 W. E. Moerner et al. First detection of single-molecule with FM spectroscopy • 1990 M. Orrit et al. Fluorescence excitation spectra of single molecules
Single molecule detection The result of ensemble measurement Emission spectrum of a single molecule Each guest molecule is in different environment. Different electronic state → Position-dependent spectrum and lifetime
Single molecules as nano-probes in evaluating microscopic properties of materials The motions of individual guest molecules strongly depend on microenvironment. Tracking the motion of guests can provide information on microscopic properties of materials: ・ Nanostructures ・ Mobility of guests (Free volume in polymer, Host-Guest Interaction, etc. ) ・ Spatial heterogeneity ....
Wide-field Microscopy 2D, but very high spatial resolution Many molecules can be observed at a time.
Single molecule tracking X0 = 274.03 +/- 0.0339 pixel Y0 = 148.17 +/- 0.0351 pixel Actual precision of tracking ~5-10 nm in our experimental set up
Cover glass Previous works: Visualization of nanoscale heterogeneity in polyHEA films 1.22 nm 2.45 nm Poly(2-hydroxyethylacrylate) [ polyHEA ] N,N’-bis(2,6-dimethylphenyl) perylene-3,4,9,10-tetracarboxylic diimide Sample preparation using spin-castingmethod single molecule Well cleaned cover glass
Previous works: Visualization of nanoscale heterogeneity in polyHEA films Trajectory (on glass substrate) Exp. Time: 500 ms Time course of step size Nanoscale heterogeneity in the sample ?
Previous works: Visualization of nanoscale heterogeneity in polyHEA films Exposure time ~ 500 ms Exposure time ~ 30.5 ms
Previous works: Visualization of nanoscale heterogeneity in polyHEA films Exposure time: 30.5ms Silicon substrate 50 nm 100 nm
Motivation of my work SMScan reveal the inhomogeneity of polymers. HOWEVER, we cannot obtain the direct information on the relation between the motions of the guest molecule and the host polymer. Dye labeled polymer chain dual-color imaging Guest dye
Dual-color single molecule tracking system ① 励起側光学系 ② 検出側光学系
Evaluation of system PMMAglass transition temperature (Tg) 82℃ → glassy state at room temperature BPPBI N,N’-3,3-Dipropyl-1,6,7,12-tetrakis(4-tert-butylphenoxy)-3,4:9,10-tetracarboxylic diimide BPTDI N,N’-3,3-Dipropyl-1,6,7,12-tetrakis(4-tert-butylphenoxy)-terrylene-3,4:11,12-tetracarboxidiimide 6μm 6μm
Evaluation of system BPPBI BPTDI ±30nm ±20nm
Diffusion motions of guest molecules Poly (2-hydroxyethyl acrylate) (PolyHEA) glass transition temperature (Tg) 17℃ → molecules show liquidity BPPBI BPTDI Distribution of diffusion coefficient
Summary • I have shown the significance of measuring single molecules in evaluating microscopic properties of materials . • Wide-field microscopy permitted the tracking of translational motions of individual molecules. • To more clearly and precisely elucidate the relation between the motion of the guest molecule and that of the host polymer, we have developed a dual-color imaging system.
Contents • Introduction -History of Single Molecule Spectroscopy -Difference between ensemble and single-molecule measurement -Information obtained only by SMS • Measurement - Single-molecule detection - Wide-field Microscope and Confocal Microscope - Single-molecule tracking • My work
Wide-field microscopy Cover glass Glass substrate Polymer film single molecule Spin-coat method Well cleaned cover glass
Difference between ensemble and single-molecule measurements The result of ensemble measurement Ensemble An emission spectrum of a single molecule “Single molecule”
PDI in PMMA (Tg ~ 355K, Mw 15000 ) ~ 10 nm Apparent diffusion coefficient < 4.0 × 10⁻⁵ m2s-1
Information obtained only by SMS Packed area slow diffusion Loose area fast diffusion Inhomogeneity in nanometer scale Free volume distribution, permittivity, density, viscosity, elasticity, etc.
Photo-curable polymeric material PA08 (Nissan Chemical inc. )(Anti-reflection layer in lithography) Ethyl lactate solution of PA08(0.36 wt%) Irgacure 184(0.022 wt%) Jpn. J. Appl. Phys.2007, 46, p7279. Irgacure184(Ciba specialty chemicals) 2000 rpm (n≒1.5) N,N’ -bis(2,6-dimethylphenyl)- perylene-3,4,9,10-tetracarboxylic diimide (PDI) UV light (2.6 w/cm2)
70% of PDI molecules: D dropped to <0.002μm2s-1. The rest 30% could diffuse as freely as in the non-reacted sample. Trajectories(UV irradiation (325 nm) duration ~ 1 sec)
3-dimentianal resolution Small background High temporal resolution Wide-field Microscope and Confocal Microscope Wide-field microscopy Confocal microscopy 2-dimentianal resolution Many molecules can be Observed at a time. High spatial resolution