Download
1 / 25
250 likes | 386 Views
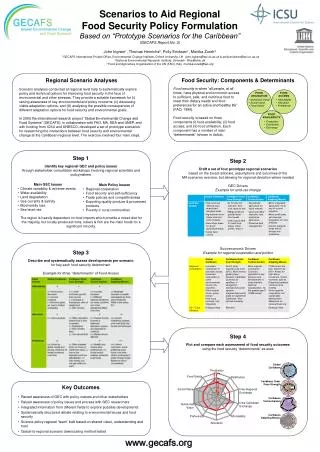
Development of Resource Use Intensity A Retrospective Approach to Draft Scenarios. Dominic Wittmer Thomas Lichtensteiger ETH Zurich – Swiss Federal Institute of Technology and Eawag – Swiss Federal Institute of Aquatic Science and Technology. Motivation. Observation:

E N D
Development of Resource Use IntensityA Retrospective Approach to Draft Scenarios Dominic Wittmer Thomas Lichtensteiger ETH Zurich – Swiss Federal Institute of Technology and Eawag – Swiss Federal Institute of Aquatic Science and Technology Sustainable Resource Management - SRM 2006, Brugge, 07.12.06
Motivation Observation: historical transfer of mineral resources • extraction out of geosphere • accumulation in anthroposphere Projected consequence: today anthropogenic stocks are the raw materials of tomorrow Findings on “urban deposits”: • knowledge about is limited and random • lack of methods for their exploration – especially the trace elements Sustainable Resource Management - SRM 2006, Brugge, 07.12.06
COPPER Motivation • Characteristics: • plasticity • electr. conductivity • therm. conductivity • warm colour • alloyability • recyclability Observation: historical transfer of mineral resources • extraction out of geosphere • accumulation in anthroposphere Projected consequence: today anthropogenic stocks are the raw materials of tomorrow Findings on “urban deposits”: • knowledge about is limited and random • lack of methods for their exploration – especially the trace elements Sustainable Resource Management - SRM 2006, Brugge, 07.12.06
Methodical Procedure SUBSTANCE FLOW ANALYSIS characterising SURVEY OF THE STOCKS RECORDING growth curves DYNAMIC MODELLING (SFA) scenarios Sustainable Resource Management - SRM 2006, Brugge, 07.12.06
Driving and driven – Perception of the Metabolism consequence flow-driven approach NEEDS demand for products demand for products FLOWS STOCKS stock-driven approach consequence Sustainable Resource Management - SRM 2006, Brugge, 07.12.06
System Analysis: Regional copper management Sustainable Resource Management - SRM 2006, Brugge, 07.12.06
Survey of the Stocks: Buildings Sustainable Resource Management - SRM 2006, Brugge, 07.12.06
Structuring the Copper Stock in BuildingsRelevant Application Ranges and affiliated Product Groups Sustainable Resource Management - SRM 2006, Brugge, 07.12.06
Survey of the Stocks: Buildings • Definition and determination of key sizes (per product group): • installation density • specific mass • copper concentration • frequency of products • frequency of the material (Cu) Sustainable Resource Management - SRM 2006, Brugge, 07.12.06
Utilisation types & age classes yr of construction/renovation • partial stock withinthe building stock • 4 utilisation types • 4 age classes (per quarter) • 14 product groups Sustainable Resource Management - SRM 2006, Brugge, 07.12.06
Copper Stocks in Buildings per Application Rangegiven in [kg/capita] rounded, divided into the four utilisation types, 2000 roofs (32) PRB OFB 6 8 OFB: one-family buildings MFB: multi-family buildings SB: service buildings PRB: production buildings SB 6 MFB 12 power systems (24) heating systems (13) sanitary systems (9) PRB SB OFB <1 PRB 2 PRB 3 1 6 OFB MFB OFB SB 2.5 6 5 1.5 SB MFB MFB 9 6 4 Sustainable Resource Management - SRM 2006, Brugge, 07.12.06
Copper Stocks in Infrastructure per Application Rangegiven in [kg/capita], 2000 cables telecommunication network electricity network 74 kg/capita 16 kg/capita 88 kg/capita traffic 2 kg/capita transformers 5 kg/capita overhead power wires 9 kg/capita Sustainable Resource Management - SRM 2006, Brugge, 07.12.06
Copper stock development shown by the example of one-family buildings 80 copper stock [in 1000 t] 70 60 50 40 30 I 20 II 10 III 0 IV IV III Elektroinstallation II Telekommunikation Quartale 25 a I Heizungsinstallation Sanitärinstallation Dachgaupen Blitzableiter Dachentwässerung Bedachung/Abdeckung product groups Sustainable Resource Management - SRM 2006, Brugge, 07.12.06
results Stock Development Temporal Variability of the Frequency of Copper (fM)Example: heating pipes in panel heating, given in [%] market share copper cuprotherm Source: expert interviews (SELM 2002) and technical literature. Sustainable Resource Management - SRM 2006, Brugge, 07.12.06
180 180'000 Historical foreign trade statisticsData used for calibration of dynamic model Foreign Trade of Inhabitants Copper Goods 160 160'000 [1'000] [1'000 t/a] 140 140'000 120 120'000 Imports 100 100'000 80 80'000 Exports 60 60'000 40 40'000 20 20'000 Population 0 0 1900 1920 1940 1960 1980 2000 • Net Addition to Stock, 20th century • (incl. landfill) • rising from 1 to >10 kg/capita*a • now decoupling ? 13 Per-Capita 12 Net Imports of 11 Copper Goods 10 [kg/(capita*a)] 9 8 7 6 5 4 3 2 1 0 1900 1920 1940 1960 1980 2000 Sustainable Resource Management - SRM 2006, Brugge, 07.12.06
Copper Household of Switzerland, 2000Results of the dynamic modelling 2000 1975 1950 1925 1900 original system: 56 system variables, 45 system parameters Sustainable Resource Management - SRM 2006, Brugge, 07.12.06
results System Copper Household of Switzerland 1950 results of the dynamic modelling: snapshots in the 20th century 1900 Net Addition to Stock, per (capita*a) Sustainable Resource Management - SRM 2006, Brugge, 07.12.06
-15kt discussion Scenario (I) Influence of Building Conversion on the Copper HouseholdScenario: production buildings (PB) → multi-family buildings (MFB) 400 318'000 t 351'000 t stock [1'000 t] (PB + MFB) 300 roofs sanitary systems heating systems telecomm.systems power systems 200 100 0 "Status Szenario quo" Ia gross floor area (GFA) roofage area (RA) given in [106 m2] PB GFA RA 261 118 „Conversion“ MFB GFA RA 414 134 675 252 Sustainable Resource Management - SRM 2006, Brugge, 07.12.06
discussion Scenario(I) Copper Household of Switzerland, 2000Scenario: induced stock changes and flows, respectively stock change 80 [1'000 t] input 76 output 60 47 45 40 sheets pipes andraw armatures cables 31 25 20 7 0 roofs heating+watersystems elec.+telec.systems Sustainable Resource Management - SRM 2006, Brugge, 07.12.06
discussion Dynamic Model Growth Curves of the Stocksgiven in [kg/capita] stocks in buildings (total) linear-logistic inorganic resources, incl. deposits environmental compartments Sustainable Resource Management - SRM 2006, Brugge, 07.12.06
flow Fluss [kg/(capita*a)] “self supply” “use loss” Consequences 100 % 30-50% • self supply will about double within next 100yrs • „use losses“ to landfill will generally correlate with stock size • avg. life time: immovabels 40±20 a, movables 14±7a • prolongation (violet) 60±20 a, movables 20±7a • shortening (turqois) 30±10 a, movables 10±7a Sustainable Resource Management - SRM 2006, Brugge, 07.12.06
Comparison of Total Copper Stock for Selected Regions CH USA, 1990 290 Stockholm, 1995 170 Sweden, 1999 140 Cape Town South Africa 2000 , ) ( 50 Welt, 2000 50 Welt, 1950 14 stocks [kg/capita] 0 100 200 300 400 500 600 N.B.: Stocks in landfills not considered for „Stockholm“ and „Schweden“, grey area for US. Sources: USA (Zeltner et al. 1999); Stockholm (Sörme et al. 2001); Schweden (Landner und Lindeström 1998); Cape Town (van Beers und Graedel 2003); Welt 2000; (Lichtensteiger 2002); Welt 1950 (Henstock 1996). Sustainable Resource Management - SRM 2006, Brugge, 07.12.06
Roof Schweiz Sanitary systems Heating systems Telecommunication systems Power systems Stockholm Cape Town copper stock [kg/capita] 0 20 40 60 80 Regional Comparison of Copper Stock in Buildings Sustainable Resource Management - SRM 2006, Brugge, 07.12.06
Conclusions • “Urban exploration” by combination of SFA, survey of stocks and retrospective modelling • Methodical results indicate that stock-driven approachare adequate for understanding and forecasts of long-living goods Outlook • Application of the exploration method on other substances • Drafts for a Zinc model are planned with methodical • emphasis on comparison between elements and countries Sustainable Resource Management - SRM 2006, Brugge, 07.12.06
Development of Resource Use IntensityA Retrospective Approach to Draft Scenarios Dominic Wittmer Thomas Lichtensteiger ETH Zurich – Swiss Federal Institute of Technology and Eawag – Swiss Federal Institute of Aquatic Science and Technology Contact address: Dominic Wittmer d.wittmer@csd.ch CSD Holding AG, Switzerland Division of Environmental Geology, Contaminated Sites and Waste Deposits Sustainable Resource Management - SRM 2006, Brugge, 07.12.06