
Uploaded by
turi
1 SLIDES
135 VIEWS
20LIKES
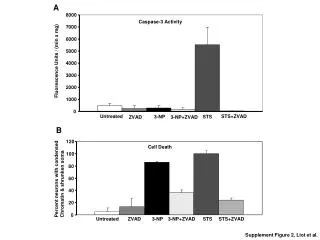
Comparative Analysis of Caspase-3 Activity in Untreated and Treated Neuronal Cells
DESCRIPTION
This study examines the impact of different treatment regimens on Caspase-3 activity in neuronal cells, highlighting key variations in fluorescence units per minute per milligram.
Download
1 / 1
Download Presentation 
Comparative Analysis of Caspase-3 Activity in Untreated and Treated Neuronal Cells
An Image/Link below is provided (as is) to download presentation
Download Policy: Content on the Website is provided to you AS IS for your information and personal use and may not be sold / licensed / shared on other websites without getting consent from its author.
Content is provided to you AS IS for your information and personal use only.
Download presentation by click this link.
While downloading, if for some reason you are not able to download a presentation, the publisher may have deleted the file from their server.
During download, if you can't get a presentation, the file might be deleted by the publisher.
E N D
Presentation Transcript
A 8000 Caspase-3 Activity 7000 6000 5000 Fluorescence Units / (min x mg) 4000 3000 2000 1000 0 Untreated STS+ZVAD 3-NP STS ZVAD 3-NP+ZVAD B 120 Cell Death 100 80 Percent neurons with condensed Chromatin & shrunken soma 60 40 20 0 Untreated ZVAD 3-NP 3-NP+ZVAD STS STS+ZVAD Supplement Figure 2, Liot et al.


More Related