Download
1 / 9
130 likes | 424 Views
Solubility Curves. The amount of a solute that will dissolve is a solvent depends upon the temperature of the solution. The data to the right is how many grams of KNO 3 solid that will dissolve in 100ml of water at different temperatures. Temperature Mass 0 o C 15g 10 o C 23g

E N D
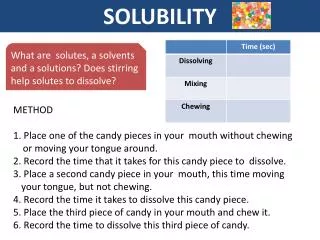
Solubility Curves The amount of a solute that will dissolve is a solvent depends upon the temperature of the solution.
The data to the right is how many grams of KNO3 solid that will dissolve in 100ml of water at different temperatures. Temperature Mass 0oC 15g 10oC 23g 20oC 34g 30oC 47g 38oC 60g KNO3 dissolved in water
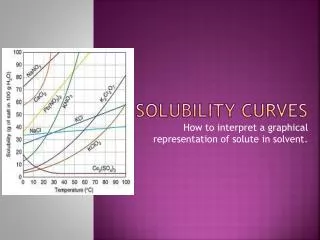
KNO3 dissolved in water This graphs shows the relationship between how much solid potassium nitrate will dissolve in water at different temperatures. Notice how it is not a straight line, but curves upward. The hotter the water, the more potassium nitrate will dissolve.
Question? How much Potassium Nitrate will dissolve at 25 degrees Celsius? Follow the line up from 25 degrees and then over to the mass.
Solubility Curve of NH3 Notice how the curve is different from the solid potassium nitrate. The reason is simple, ammonia (NH3) is a gas. Therefore it is less soluble in hot water.
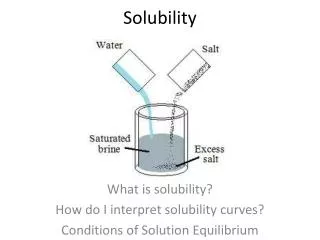
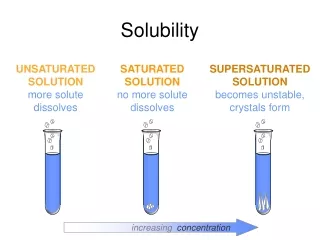
Saturated Solution Any point on the line indicates a saturated solution. Saturated means the solvent has dissolved as much solute as possible.
Unsaturated Solution • The red area of the graph represents an unsaturated solution. Less solute is dissolved than a saturated solution.
Supersaturated Solution • The red area of the graph represents a supersaturated solution. More solute is dissolved than a saturated solution.
Use this graph to help you answer the rest of the questions.