Synchrotrons
Discover the power of synchrotron radiation in analyzing minerals at a molecular level, along with insights from nuclear magnetic resonance and advanced electron microscopy/spectroscopy techniques. Unleash the capabilities of X-ray microprobes, spectroscopy, and magnetism for cutting-edge research.

Synchrotrons
E N D
Presentation Transcript
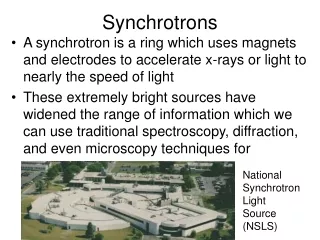
Synchrotrons • A synchrotron is a ring which uses magnets and electrodes to accelerate x-rays or light to nearly the speed of light • These extremely bright sources have widened the range of information which we can use traditional spectroscopy, diffraction, and even microscopy techniques for National Synchrotron Light Source (NSLS)
XANES and EXAFS • X-ray adsorption near-edge spectroscopy and Extended X-ray adsorption Fine Structure, commonly done with synchrotron radiation because the higher energy X-ray yields more precise data • X-ray techniques which look at the fine details of X-ray interactions with minerals • Sensitive to oxidation states and specific bonding environments
Other synchrotron-based techniques • X-ray microprobe, spectromicroscopy – use synchrotron X-rays to image and do elemental mapping of a sample (including trace elements) • X-ray standing wave – analyses very close to the surface – ‘see’ steps, adsorbed ions • Techniques applicable to the water/mineral interface – probe chemistry, mineral changes
Magnetic Techniques • Electron Paramagnetic Spectroscopy (EPR) utilizes the magnetic properties of minerals and the ions that may be impurities in an overall mineral structure Fe3+ Zn2+
Nuclear Magnetic Resonance (NMR) • A technique based on analysis of isotopes with a spin character (related to e- distribution) which can be affected by a magnet • This spin is used to characterize the structure and bonding of thise elements • NMR ‘active’ materials include 29Si, 31P, 14N, 13C, 1H
Secondary e- Electron Microscopy/ Spectroscopy • Interaction of electrons with a sample
e- scattering off bulk sample • Backscattered Electrons: Caused by an incident electron colliding with an atom in the specimen which is nearly normal to the incident's path. The incident electron is then scattered "backward" 180 degrees. • Utilization -The production of backscattered electrons varies directly with the specimen's atomic number. This differing production rates causes higher atomic number elements to appear brighter than lower atomic number elements. • Secondary Electrons: Caused by an incident electron passing "near" an atom in the specimen, near enough to impart some of its energy to a lower energy electron. This causes a slight energy loss and path change in the incident electron and the ionization of the electron in the specimen atom. This ionized electron then leaves the atom with a very small kinetic energy (5eV) and is then termed a "secondary electron". Each incident electron can produce several secondary electrons. • Utilization - Production of secondary electrons is very topography related. Due to their low energy, 5eV, only secondaries that are very near the surface (<10nm, seeInteraction Volume) can exit the sample and be examined. Any changes in topography in the sample that are larger than this sampling depth will change the yield of secondaries due to collection efficiencies. • Auger Electrons and X-rays –these emmissions are caused by the formation of secondary electrons and rearrangements of electrons as a result of emission. • Utilization – Auger electrons or X-rays emitted from the atom will have a characteristic energy which is unique to the element from which it originated.
e- penetration into a sample • Details dependent on mineral composition and accelerating voltage of e- beam, but for SEM applications:
Scanning electron microscope (SEM) • The electron gun, produces a stream of electrons. • A series of condensers and apertures (i.e. lenses and holes) restricts the electron flow to a nice, tight beam • A set of coils then "scan" or "sweep" the beam in a grid fashion (like a television), dwelling on points for a period of time determined by the scan speed (usually in the microsecond range) • The final lens, the Objective, focuses the scanning beam onto the part of the specimen desired. • When the beam strikes the sample (and dwells for a few microseconds) interactions occur inside the sample and are detected with various instruments • Before the beam moves to its next dwell point these instruments count the number of interactions and display a pixel on a CRT whose intensity is determined by this number (the more reactions the brighter the pixel). • This process is repeated until the grid scan is finished and then repeated, the entire pattern can be scanned 30 times per second.
SEM – what do we get? • Topography (surface picture) – commonly enhanced by ‘sputtering’ (coating) the sample with gold or carbon
But wait – that’s not all! • SEM also detects electrons and x-rays which identify electron density distributions (Back-Scattered Electrons) and chemical identity (Auger and X-rays) using specific detectors (BSE, EDX, Auger)
e- that go through a sample • Unscattered Electrons - Incident electrons which are transmitted through the thin specimen without any interaction occurring inside the specimen. • Utilization - The transmission of unscattered electrons is inversely proportional to the specimen thickness. • Elasticity Scattered electrons - Incident electrons that are scattered (deflected from their original path) by atoms in the specimen in an elastic fashion (no loss of energy). These scattered electrons are then transmitted through the remaining portions of the specimen. • Utilization - All electrons follow Bragg's Law and thus are scattered according spacing between planes. All incidents that are scattered by the same atomic spacing will be scattered by the same angle. These "similar angle" scattered electrons can be collated using magnetic lenses to form a pattern of spots; each spot corresponding to a specific atomic spacing (a plane). This pattern can then yield information about the orientation, atomic arrangements and phases present in the area being examined. Very small particles will yield rings instead of spots (nanometer-sized xstals) • Inelastically Scattered Electrons - Incident electrons that interact with specimen atoms in a inelastic fashion, loosing energy during the interaction. These electrons are then transmitted trough the rest of the specimen • Utilization :Electron Energy Loss Spectroscopy: The inelastic loss of energy by the incident electrons is characteristic of the elements that were interacted with. These energies are unique to each bonding state of each element and thus can be used to extract both compositional and bonding (i.e. oxidation state) information on the specimen region being examined.
Secondary e- Electron Microscopy/ Spectroscopy • Interaction of electrons with a sample – can make the sample thinner and ‘shoot’ e- with higher energy, more of them go through the sample.
Transmission Electron Microscopy (TEM) • Electron beam transmitted just as in the SEM • This transmitted portion is focused by the objective lens into an image • Optional Objective and Selected Area metal apertures can restrict the beam; the Objective aperture enhancing contrast by blocking out high-angle diffracted electrons, the Selected Area aperture enabling the user to examine the periodic diffraction of electrons by ordered arrangements of atoms in the sample • The image is passed down the column through the intermediate and projector lenses, being enlarged all the way • The image strikes the phosphor image screen and light is generated, allowing the user to see the image. The darker areas of the image represent those areas of the sample that fewer electrons were transmitted through (they are thicker or denser). The lighter areas of the image represent those areas of the sample that more electrons were transmitted through (they are thinner or less dense)
TEM (+ HRSTEM) – What do we get? • ‘See’ smallest features with this – sub-nm! • Morphology – size, shape, arrangement of particles on scale of atomic diameters • Crystallographic information – from diffracted electons, get arrangement and order of atoms as well as detection of atomic-scale defects • Compositional information – Chemical identity, including redox speciation (distinguish Fe2+ and Fe3+ for instance)
Electron Microprobe • Very similar to SEM and TEM in many respects, but utilizes ‘thick sections’ and a set of detectors which measure the emitted X-Rays from e- bombardment and excitation more accurately than the detectors used in SEM or TEM analyses • These detectors are wavelength dispersive spectrometry (WDS) detectors, there are usually an array of 3-5 which record over some range of wavelength much more accurately than the EDX detector available with SEM and TEM instruments
Scanned proximity probes • Use a probe or ‘tip’ which is placed very close to the sample • Measures either the attractive or repulsive forces between the sample and probe to image the property in question • This property can be physical height, absorption of light (or other parts of EM spectrum), electrical ‘flow’, or magnetic/electrostatic attraction/ repulsion (+- or ++ charges coming together)
Atomic Force Microscopy (AFM) • Can be done in water or air (unlike SEM/TEM which requires a vacuum) • The probe is attached to a cantilever spring, in which the force ‘sensed’ is measured • Get topograpgic information at an atomic scale 2.5 nm2 rendering of a surface – what are the bumps?? Scanning tunneling microscopy (STM) is the precursor to this technique, and is still used to yield similar information