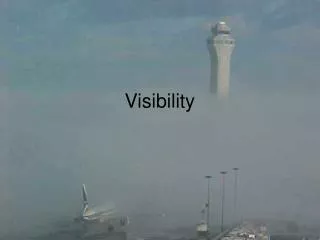
The ASOS Visibility Sensor
Report, June 2002 Evaluation of the ASOS Light Scattering Network Submitted by Rudolf B. Husar Center for Air Pollution Impact and Trend Analysis Submitted to James F. Meagher NOAA Aeronomy Laboratory R/AL Boulder Colorado. The ASOS Visibility Sensor.

The ASOS Visibility Sensor
E N D
Presentation Transcript
Report, June 2002Evaluation of the ASOS Light Scattering NetworkSubmitted byRudolf B. HusarCenter for Air Pollution Impact and Trend AnalysisSubmitted to James F. MeagherNOAA Aeronomy Laboratory R/ALBoulder Colorado
The ASOS Visibility Sensor • The ASOS visibility sensor is a forward scattering instrument
ASOS Stations from FAA, NWS and Archived at NCDC For this analysis data for 220 stations were available from the NCDC archive These ASOS sites are mostly NWS sites, uniformly distributed over the country (Imagine if we could get the entire set, including the DOD sites, not listed)
June 2002 Fires in CO, NM, UT MODIS 020609
Data Quality Assessment • Co-located ASOS Sensors – absolute calibration • Lower detection limit (0.05 km-1, 50 km visual range) • Random sensor malfunctions • File format problems
Comparison of Sites with Duplicate ASOS Sensors • Co-located ASOS sensors are installed at different runways of the same airport. • Dual ASOS sensors (55) are distributed uniformly over the 800+ station network • Triple sensors are particularly useful for sensor calibration and consistency checking
Duplicate Sensors: Good Sites Dallas-FW, TX Erie, PA • At several duplicate sites the 2-sensor correlation is excellent and the absolute values also match. • This indicates that the scattering sensor per se has high precision and temporal stability. San Diego, CA Houston, TX
Tulsa, OK Atlanta, GA Duplicate Sensors:Mediocre Sites • Some sites (e.g. Tulsa, OK) show very high correlation between the sensors but they are off by a factor. • Other sites indicate poorer correlation and a significant offset.
Albuquerque, NM Duluth, MN Albuquerque, NM Duplicate Sensors:Poor Sites • Duplicate sensors at some sites show significant deviation in scale and offset. • The nature of these deviations indicate poor instrument calibration maintenance for the ASOS visibility sensors.
Three Sensor Comparison Cleveland, OH • At 7 NWS Sites, there are 3 ASOS visibility sensors which allow more detailed sensor evaluation. • Both at Cleveland, OH and Hartford, CT Bext1 and Bext3 show excellent correlation, R2=0.99 • On the other hand, the Bext1 and Bext2 correlation is poor. This indicates that the Bext2 sensor either • produces bad data or • it is located at a site with significantly different Bext Hartford, CT
Three Sensor Comparison New York JFK New York La Guardia
Washington, Dullas Philadelphia, PA
Comparison of Sites with Duplicate ASOS Sensors At the St. Louis Lambert airport, the Bext from the two ASOS sensors track well (right, top) However, the absolute magnitude of the Bext values differ by a factor When the ASOS sensor values are multiplied by a 1.66, the two signals are virtually identical (right, bottom) This indicates that at this site, the absolute calibration of the sensors differs by a factor of 1.66
ASOS Bext Threshold: 0.05 km(-1) • The Bext values below 0.05 km-1 are reported as 0.05. • For Koschmieder coeff K=3.9, this threshold VR=78km(~ 50 mile); for K=2 VR=40km(~25mi) • In the pristine SW US, the ASOS threshold distorts the data • Over the East and West, the ASOS signal is well over the threshold most of the time
Evidence of ASOS Data Problems Occasionally, the Bext values are replaced the threshold value of 0,05 km-1. The ASOS data for Temperature and Dewpoint appear to be erratic for some stations The problems include constant values, spikes and rapid step changes.
Data Problems: Bad data records • The main data reading problems are due to bad records • Some records for some stations are not fixed length • Cause of the bad data records need to be identified
ASOS Data Pattern Analysis • Diurnal Cycle • RH Dependence of Bext • ASOS Bext – PM2.5 Relationship
Typical Diurnal Pattern of Bext, Temperature and Dewpoint • Typically, Bext shows a strong nighttime peak due to high relative humidity. • Most of the increase is due to water absorption by hygroscopic aerosols. At RH >90% , the aerosol is mostly water • At RH < 90%, the Bext is mostly influenced by the dry aerosol content; the RH effect can be corrected. Macon, GA, Jul 24, 2000
Diurnal Cycle of Relative Humidity and Bext Relative Humidity The diurnal RH cycle causes the high Bext values in the misty morning hours The shape of the RH-dependence is site (aerosol) dependent – needs work Bext
Adopted RH Correction Curve(To be validated for different locations/seasons) RH is calculated fromT – Temperature, deg C and D – Dewpoint, deg C RH = 100*((112-(0.1*T)+D)/(112+(0.9*T)))8 • The ASOS Bext value are filtered for high humidity • Values at RH >= 80% is not used • Later we will try to push the RH correction to 90%) • The Bext is also corrected for RH: RHCorrBext = Bext/RHFactor
Seasonal Average Diurnal Bext Pattern • For each minute of the day, the data were averaged over June, July and August, 2000 • Average Bext was calculated for • Raw, as reported • For data with RH < 90% • RH < 90% and RH Corrected • Based on the three values, the role of water can be estimated for each location
Location of ASOS and Nearby Hourly PM2.5 Sites • There are no co-located ASOS and PM2.5 sites • The stations are not co-located but in the same city • Hourly PM2.5 data are compared to the filtered and RH-corrected one minute Bext
ASOS-Hourly PM2.5 Grand Rapids, MI • In Grand Rapids, MI, July, the relationship is good. • Occasional spikes of Bext are probably weather events not adequately filtered
Summary – Tentative Conclusions • Data quality for 220 archived ASOS Weather Service stations were examined using duplicate sensors and comparison with hourly PM2.5 concentration. • Duplicate sensors at multiple runways show good tracking but the absolute scattering differs up to a factor of two and there is also evidence of systematic offset at 20+ % of the sensors. This indicates calibration/maintenance problems. The reported data completeness is well over 90%. • Comparison of ASOS data (RH-filtered and corrected for RH) with hourly nearby PM2.5 concentration at 27 sites is most encouraging. The weather-filtering and correction procedures need further analysis. • The 1000 station, one minute ASOS scattering dataset would be a useful surrogate and augmenter of PM2.5 concentration data over the hazy Eastern US. While the sensor are evidently satisfactory, the current calibration procedures appear to be inadequate.
Application of ASOS Bext Data:ASOS and In Combination with Other Aerosol Sensors Primary Application: Flight Safety - Airport Visibility Science Applications: Aerosol Characterization • Aerosols are distributed over space (x,y,x,t), particle size and chemical composition • Non of the aerosol sensor systems covers this 6 dimensional data space • The only chance for even crude characterization atmospheric aerosols is by combining the available aerosol sensory data
Combinations of ASOS with Other Data • ASOS & Satellite Data Fusion: New information on aerosol height • ASOS & Satellite: High space-time coverage (e.g. smoke disasters) • ASOS as PM25 Surrogate: Better exposure assessment