Download

1 / 23
260 likes | 414 Views
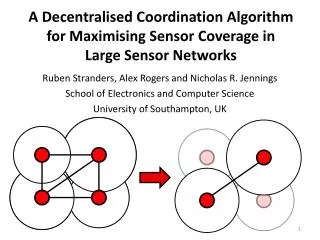
A Quality Control Algorithm for the ASOS Ice Free Wind Sensor. Presented by: Chet Schmitt, Field Systems Operations Center/Observing Systems Branch Phone: 301-713-2093 Ext 214 E-Mail: chet.schmitt@noaa.gov. Sensor Group. Data Collection Package (DCP). Acquisition Control Unit (ACU).

E N D
A Quality Control Algorithm for the ASOS Ice Free Wind Sensor Presented by: Chet Schmitt, Field Systems Operations Center/Observing Systems Branch Phone: 301-713-2093 Ext 214 E-Mail: chet.schmitt@noaa.gov
Sensor Group Data Collection Package (DCP) Acquisition Control Unit (ACU)
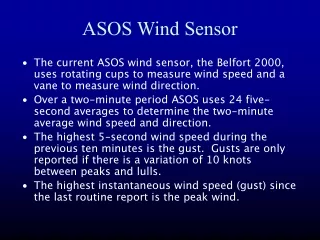
Iced up during periods of freezing rain, requiring hazardous, costly maintenance visits and data loss. Belford 2000 Cup & Vane Wind Sensor
Decision was made to replace the cup & vane configuration with the Vaisala Sonic anemometer across the entire ASOS network in order to prevent further icing problems. Vaisala NWS 425 Sonic Anemometer
Decision was made to replace the cup & vane configuration with the Vaisala Sonic anemometer across the entire ASOS network in order to prevent further icing problems. • Other reasons cited included: more accurate wind observations due to shorter sensor response time and lower maintenance costs. Vaisala NWS 425 Sonic Anemometer
Decision was made to replace the cup & vane configuration with the Vaisala Sonic anemometer across the entire ASOS network in order to prevent further icing problems. • Other reasons cited included: more accurate wind observations due to shorter sensor response time and lower maintenance costs. • Installation began in late 2005 and continued through 2006 into 2007. Vaisala NWS 425 Sonic Anemometer
Bird activity and ice build-up on the IFWS has generated numerous erroneous wind observations • Hardware solutions (such as a bird abatement device) are being employed to mitigate the problem • An algorithmic solution is also needed for those times when problems are unavoidable, such as ice build up during a power outage. • FSOC has developed a simple, yet robust QC Algorithm that is cause independent.
At the sensor: 1) Every 1 second, the wind direction and speed are sampled. 2) Every 1 second, a running average of the most recent 3 seconds of data is computed, producing the “3 second peak” 3) Every 5 seconds, the average of the most recent 5 seconds of data is computed, producing the “5 second average”. The highest 3 second peak is determined and is stored as the 3 second peak.
At the sensor: 1) Every 1 second, the wind direction and speed are sampled. 2) Every 1 second, a running average of the most recent 3 seconds of data is computed, producing the “3 second peak” 3) Every 5 seconds, the average of the most recent 5 seconds of data is computed, producing the “5 second average”. The highest 3 second peak is determined and is stored as the 3 second peak. Discrete 5 second average Discrete 5 second average Discrete 5 second average Discrete 5 second average Time (seconds) 0 1 2 3 4 5 6 7 8 9 10 11 12 13 14 15 16 17 18 19 20 : Running 3 second average (i.e. 3 sec. peak) : Indicates 5 second discrete average to which the corresponding 3 sec peak is assigned
At the sensor: 1) Every 1 second, the wind direction and speed are sampled. 2) Every 1 second, a running average of the most recent 3 seconds of data is computed, producing the “3 second peak” 3) Every 5 seconds, the average of the most recent 5 seconds of data is computed, producing the “5 second average”. The highest 3 second peak is determined and is stored as the 3 second peak. Discrete 5 second average Discrete 5 second average Discrete 5 second average Discrete 5 second average Time (seconds) 0 1 2 3 4 5 6 7 8 9 10 11 12 13 14 15 16 17 18 19 20 : Running 3 second average (i.e. 3 sec. peak) : Indicates 5 second discrete average to which the corresponding 3 sec peak is assigned
At the sensor: 1) Every 1 second, the wind direction and speed are sampled. 2) Every 1 second, a running average of the most recent 3 seconds of data is computed, producing the “3 second peak” 3) Every 5 seconds, the average of the most recent 5 seconds of data is computed, producing the “5 second average”. The highest 3 second peak is determined and is stored as the 3 second peak. Discrete 5 second average Discrete 5 second average Discrete 5 second average Discrete 5 second average Time (seconds) 0 1 2 3 4 5 6 7 8 9 10 11 12 13 14 15 16 17 18 19 20 6.0 4.0 6.0 9.0 6.0 4.0 6.0 : Running 3 second average (i.e. 3 sec. peak) : Indicates 5 second discrete average to which the corresponding 3 sec peak is assigned
At the sensor: 1) Every 1 second, the wind direction and speed are sampled. 2) Every 1 second, a running average of the most recent 3 seconds of data is computed, producing the “3 second peak” 3) Every 5 seconds, the average of the most recent 5 seconds of data is computed, producing the “5 second average”. The highest 3 second peak is determined and is stored as the 3 second peak. Discrete 5 second average Discrete 5 second average Discrete 5 second average Discrete 5 second average Time (seconds) 0 1 2 3 4 5 6 7 8 9 10 11 12 13 14 15 16 17 18 19 20 6.0 4.0 6.0 9.0 6.0 4.0 6.0 WS5 = 6.2 WS3 = 7.0 : Running 3 second average (i.e. 3 sec. peak) 5.3 6.3 7.0 : Indicates 5 second discrete average to which the corresponding 3 sec peak is assigned 6.3 5.3
At the sensor: 1) Every 1 second, the wind direction and speed are sampled. 2) Every 1 second, a running average of the most recent 3 seconds of data is computed, producing the “3 second peak” 3) Every 5 seconds, the average of the most recent 5 seconds of data is computed, producing the “5 second average”. The highest 3 second peak is determined and is stored as the 3 second peak. Discrete 5 second average Discrete 5 second average Discrete 5 second average Discrete 5 second average Time (seconds) 0 1 2 3 4 5 6 7 8 9 10 11 12 13 14 15 16 17 18 19 20 6.0 4.0 6.0 9.0 6.0 4.0 6.0 WS5 = 6.2 WS3 = 7.0 : Running 3 second average (i.e. 3 sec. peak) 5.3 6.3 7.0 : Indicates 5 second discrete average to which the corresponding 3 sec peak is assigned 6.3 5.3 - WS5, WS3 along with sensor diagnostic information is sent every 5 seconds to the ASOS ACU
Current ASOS software: Uses the a P/F flag from the sensor to determine if a sample will be used. Also utilizes the following quality control checks: • IF WS2min <= 5 knots AND WS3 is greater than 2.5 times WS2min, THEN mark WS3 as invalid • IF WS5 is less than 0 or greater than 165, THEN set WS5 to “missing”
Current ASOS software: Uses the a P/F flag from the sensor to determine if a sample will be used. Also utilizes the following quality control checks: • IF WS2min <= 5 knots AND WS3 is greater than 2.5 times WS2min, THEN mark WS3 as invalid • IF WS5 is less than 0 or greater than 165, THEN set WS5 to “missing” • QC Algorithm: • Evaluates each 5 second sample from the sensor against 9 criteria. Samples failing to meet 1 or more of the 9 criteria are flagged as suspect. • Algorithm also looks at the pattern of flagged data to determine if the data stream itself is suspect. • Samples that are flagged as suspect are recorded and bracketed in the 14 hour archive, but are NOT used in any of the ASOS wind algorithms.
5 second samples from IFWS • Flag samples as suspect when: • P/F flag from the sensor is “F” • Signal quality is less than 79 • (WS3peak - WS5avg) < -1 • WS5avg >= 12 AND |(WD5avg – WD3peak)| > 30 • WS5avg >= 12 AND WS3peak > (2.5 * WS2Min) • WS5avg < 12 AND WS3peak > 30 • WS2Min <= 6 AND WS3peak > 6 AND WS3peak > (2.5 * WS2Min) • WS5avg > 165 OR WS3peak > 165 • WT5 ≠ 5 OR WT3 ≠ 3
5 second samples from IFWS • Flag samples as suspect when: • P/F flag from the sensor is “F” • Signal quality is less than 79 • (WS3peak - WS5avg) < -1 • WS5avg >= 12 AND |(WD5avg – WD3peak)| > 30 • WS5avg >= 12 AND WS3peak > (2.5 * WS2Min) • WS5avg < 12 AND WS3peak > 30 • WS2Min <= 6 AND WS3peak > 6 AND WS3peak > (2.5 * WS2Min) • WS5avg > 165 OR WS3peak > 165 • WT5 ≠ 5 OR WT3 ≠ 3 • Additional Quality Control Checks: • If 7 or more of the preceding 24 samples have been flagged (75% rule), all subsequent samples will be flagged until there are 18 consecutive samples which meet the nine criteria. • NOTE: Due to a dearth of high wind test data, the algorithm has not been thoroughly tested at high winds. Thus the QC algorithm is suspended when 2 minute average wind speed exceeds 35 knots.
Evaluate Sample against 9 QC criteria QC Algorithm Logic Does the sample meet ALL 9 criteria? NO Mark the sample as suspect. DO NOT pass the sample into the ASOS Wind algorithms, bracket in the 14 hour archive. YES Has there been 18 consecutive samples that have met all 9 QC criteria since the 75% rule was last violated? NO YES Pass the sample into the ASOS Wind algorithms.
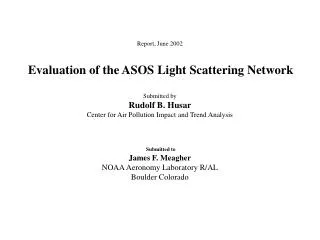
QC Algorithm Testing Tests were conducted using real world ASOS data collected from a variety of sites under a wide range of meteorological and environmental conditions. Amount of data tested: 4002.1 Hours • While the majority of good data rejected was of one or two ordinary samples, occasionally the algorithm would wrongfully reject a piece of good data that is of significance. Case in point: severe thunderstorm in Topeka, KS on April 11. Not all samples are equal…. • Test data for tropical storm/hurricane conditions is lacking
KMYV 200035Z AUTO 00000KT 10SM CLR 17/10 A3008 KMYV 200040Z AUTO 12003KT 10SM CLR 17/11 A3009 KMYV 200045Z AUTO 10SM CLR 17/12 A3008 KMYV 200050Z AUTO 00000KT 10SM CLR 16/12 A3008 KMYV 200055Z AUTO 09004G79KT 10SM CLR 16/12 A3008 KMYV 200100Z AUTO 09004KT 10SM FEW060 15/12 A3008 KMYV 200105Z AUTO 09003KT 10SM SCT055 16/12 A3008
QC Algorithm Implementation Schedule • Coding of QC Algorithm into operational ASOS Firmware load: Jan-Feb 2009 • System Test: Spring 2009 • Concurrent Algorithm Compliance Testing: Spring 2009 • Operational Testing and Evaluation: Summer 2009 • Nationwide deployment after successful completion of Operational Testing & Evaluation.