Download
1 / 1
10 likes | 117 Views
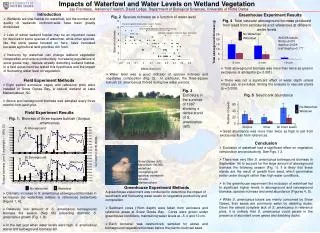
This study investigates the performance of an expanded aquaculture-wetland system at the Loma Alta Shrimp Aquaculture Facility, focusing on the effects of wetland configuration on pollutant removal. The system includes two phases: a deep wetland (Phase II) that efficiently removes ammonia-nitrogen but increases suspended solids, and a shallow wetland (Phase I) that effectively removes suspended solids, total phosphorus, and biochemical oxygen demand. Weekly water samples were analyzed for pollutants, revealing significant differences in removal efficiency related to water depth and vegetation type.

E N D
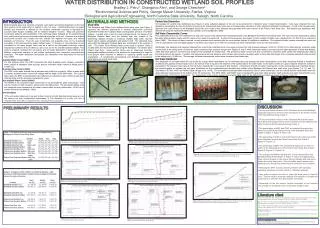
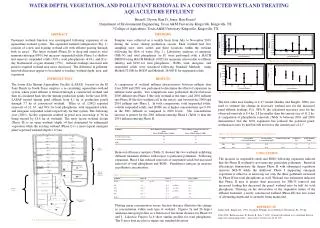
0.60 0.50 0.40 0.30 TP (mg/l) 0.20 0.10 0.00 0 0.2 0.4 0.6 0.8 1 1.2 Fractional Distance ABSTRACT Treatment wetland function was investigated following expansion of an aquaculture-wetland system. The expanded wetland configuration (Fig. 1) consists of a new and existing wetland cell with effluent passing through both in series. The latest wetland (Phase II) is deep and removes total ammonia-nitrogen (89%) but increases suspended solids, Phase I is shallow and removes suspended solids (30%), total phosphorous (41%), and five-day biochemical oxygen demand (55%). Influent loadings increased and pond to required wetland area ratios decreased. The difference in pollutant removals/increases appear to be related to loading, wetland depth, area, and vegetation. METHODS Samples were collected on a weekly basis from July to November 2001 during the active shrimp production season. Each wetland had five sampling sites; inlet, outlet, and three locations within the wetland following the flow of water (Fig. 1). Laboratory analyses of ammonia (NH3-N) and total phosphorus (as P) were performed with a HACH DR2000 using HACH Methods 10023 for ammonia (chosen due to effluent salinity) and 8190 for total phosphorus. BOD5, total, inorganic, and suspended solids were measured following Standard Methods using Method 5210B for BOD5 and Methods 2450D-E for suspended solids. WATER DEPTH, VEGETATION, AND POLLUTANT REMOVAL IN A CONSTRUCTED WETLAND TREATING AQUACULTURE EFFLUENT Fig. 2b. Phase I NH3-N vs. fractional distance. Fig. 2a. Phase II NH3-N vs. fractional distance. INTRODUCTION The Loma Alta Shrimp Aquaculture Facility (LASAF), located on the El Sauz Ranch in South Texas employs a re-circulating aquaculture-wetland system where pond effluent is filtered through a constructed wetland and then re-circulated back into the shrimp production ponds. In the year 2000, LASAF treated shrimp pond effluent from 8.1 ha of production ponds through 7.7 ha of constructed wetland. Tilley et. al. (2002) reported removals of 31, 65, and 76% for total phosphorus, total suspended solids, and inorganic suspended solids respectively for that system. The following year (2001), facility expansion resulted in pond area increasing to 36 ha being treated by 18.8 ha of wetlands. The most recent wetland design (Phase II) is an open wetland (depth >0.5m) dominated by submerged vegetation while the existing wetland (Phase I) is a more typical emergent plant vegetated wetland (depth < 0.3 m). RESULTS A comparison of wetland influent characteristics between influent data from 2000 and 2001 was performed to determine the effect of expansion on influent water quality. Two comparisons were performed; the first between 2000 influent into Phase I (the only wetland at the time), and 2001 influent into Phase II (the first wetland cell in the series), and between the 2000 and 2001 influent into Phase I. In both comparisons, total suspended solids, volatile suspended solids, and BOD5 are at higher concentrations (p< 0.05) in the 2001 influent as compared to 2000 levels. The concentration increase is greater for the 2001 influent entering Phase I (Table 1) than the 2001 influent entering Phase II. Fig. 3b. Phase I total phosphorus vs. fractional distance. Fig. 3a. Phase II total phosphorus vs. fractional distance. The first order area loading or k-C* model (Kadlec and Knight, 1996) was used to estimate the change in necessary wetland size for the increased pond effluent loadings. For NH3-N, the calculated necessary area for the observed removals is 8.4 ha, 2.8 ha smaller than the current size of 11.2 ha. A comparison of phosphorus removals (Table 3) between 2001 and 2000 demonstrates that the 2001 expansion has reduced the potential pond: wetland area ratio by half but still not below the current ratio of 4.7. Brian E. Dyson, Kim D. Jones, Ron Rosati* Department of Environmental Engineering, Texas A&M University-Kingsville, Kingsville, TX *College of Agriculture, Texas A&M University-Kingsville, Kingsville, TX Table 1. Increases in mean influent pollutant concentration. Table 3. 2001-2000 comparison of wetland area estimation for total phosphorus. . Removal efficiency analysis (Table 2) showed the two wetlands exhibiting different treatment abilities with respect to particular pollutants. Following expansion, Phase I has reduced removals of suspended solids but increased removals of total phosphorus and BOD5. Parentheses indicate an increase in pollutant concentration. Pond Expansion CONCLUSION The increase in suspended solids and BOD5 following expansion indicate that the Phase II wetland is not removing particulate pollutants. Removal efficiencies demonstrate the deeper Phase II with submerged vegetation removes NH3-N while the shallower Phase I supporting emergent vegetation is effective at removing not only the three pollutants increased by Phase II but total phosphorus as well. Wetland size estimation indicates that Phase II area is greater than necessary for NH3-N removal and increased loading has decreased the pond: wetland ratio by half for total phosphorus. Drawing on the observation of the sequential nature of the effluent treatment, a newly constructed wetland (Phase III) has five zones of alternating depth and is currently being monitored. Phase II Wetland Expansion Table 2. Pollutant removal efficiencies. Existing Ponds Plotting mean concentration versus fraction distance illustrates the change in concentration within each type of wetland. Figures 2a and 2b depict ammonia-nitrogen profiles as a function of fractional distance for Phases II and I. Likewise Figures 3a-b show similar profiles for total phosphorus. The Y-error bars are plus or minus one standard deviation. Phase I Existing Wetland REFERENCES Kadlec, R.H., Knight, R.L., 1996. Treatment Wetlands. Lewis Publishers, Boca Raton, FL., 893 pp. Tilley, D.R., Badrinarayanan, H., Rosati, R., Son, J., 2002. Constructed wetlands as re-circulation filters in large-scale shrimp aquaculture. Aquacultural Engineering 26, 81-109 Fig. 1. Expansion of Loma Alta Facility aquaculture-wetland system.