Download
1 / 29
350 likes | 691 Views
General Mills (NYSE: GIS). Ruonan Ding Meiling Liu Jinglin Pan Prateek Sharma. Date: 30-Nov-2010. Agenda. Industry Analysis Company Analysis SWOT Financial Analysis DCF Model Comparable Recommendations. Industry Overview. Food Processing Industry

E N D
General Mills (NYSE: GIS) Ruonan Ding MeilingLiu Jinglin Pan Prateek Sharma Date: 30-Nov-2010
Agenda • Industry Analysis • Company Analysis • SWOT • Financial Analysis • DCF Model • Comparable • Recommendations
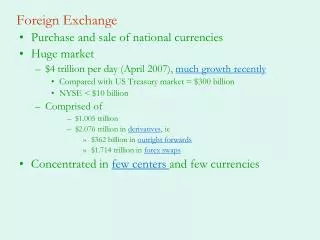
Industry Overview • Food Processing Industry • Annual production estimated at around $1tn (2004) • Key drivers • Population growth rate • Per capita disposable income • Price of grains/ raw materials • Health consciousness Source: U.S. Department of Commerce Industry Report Food Manufacturing NAICS 311 (2008) www.trade.gov/td/ocg/report08_processedfoods.pdf
Porters Five Forces • SUPPLIER POWER – MEDIUM - Most suppliers i.e. agricultural/meat producers enter into long-term contracts with companies • BARRIERS TO ENTRY – HIGH - High Capital Expenditure - Difficult to replace existing brands (Brand Loyalty) - Access to distribution channels
Porters Forces Contd. • THREAT OF SUBSTITUTES – LOW • Substitutes to processed foods are fresh foods or eating-out. Time constraint or money constraint • BUYER POWER- HIGH • Most buyers ( Wal-Mart etc.) make up a large percentage of sales • RIVALRY- HIGH • Firms compete on innovation, product differentiation and marketing/ advertising • Compete not only among themselves but also with private labels
Competitor- Kraft Foods Inc. • Kraft Foods Inc. is the largest food and beverage company in North America and the second largest in the world. • In 2007, Kraft discontinued the cereal production divesture. It only competes in snack segment with GIS. • Following its January 2010 acquisition of Cadbury, Kraft has had strong quarterly earnings, both in revenue and operating profit across all candy and snack segments.
Competitor- Kellogg • The Kellogg Company, headquartered in Michigan, manufactures and markets ready to eat cereal and convenience foods. • Kellogg holds 34.2% of the cereal market in the U.S. • Kellogg’s has managed to consistently post increases in sales revenue and net profits since 2005.
Competitor- PepsiCo • PepsiCo Americas Food is the division most applicable to this industry. Within this division, is Quaker Foods North America (QFNA). • QFNA holds about 8.0% of cereal market in the U.S. • QFNA operates four manufacturing plants in the United States. QFNA grew at an annual rate of 2.2% in the five years to 2010
The CompanyOverview • General Mills is a global food manufacturer and marketer of consumer foods sold through retail stores. They are also a supplier of food products to the food service and commercial baking industries • Manufactures its products in 15 countries and markets them in more than 100 countries • Their brands include Cheerio's, Yoplait, Nature Valley, Betty Crocker, Pillsbury, Green Giant, Old El Paso, Progresso, Cascadian Farm, Muir Glen and more
The CompanyProfile • Headquarters in Minneapolis, MN • Global workforce of 33,000 • FY2010 Net Sales: $14.8 Billion • Primary Customers • Grocery Stores, mass merchandisers, membership stores, natural food chains, drug, dollar and discount chains, commercial and non-commercial food service distributors and operators, restaurants and convenience stores
The Company Brand Portfolio • Major Product Categories • Ready-to-eat cereal, yogurt, super-premium ice cream, ready-to-serve soup, dry dinners, shelf stable and frozen vegetables, refrigerated and frozen dough products, dessert and baking mixes, flour, frozen pizza and pizza snacks, grain, fruit and savory snacks, and a wide variety of organic products like soup granola bars and cereal.
The CompanySales Segments • Their sales can be categorized into 4 segments:- • U.S Retail • $10.3 Billion business • International • $2.7 Billion business • Wholly-owned companies • Joint-ventures • Cereal Partners Worldwide (CPW): 50-50 partnership with Nestle that markets breakfast cereals in 130 countries outside of U.S • Haagen-Dazs Japan: Operates their ice cream business in Japan • Bakeries & Foodservice • $1.8 Billion business Source: General Mills Inc. Corporate Brochure 2010 http://www.generalmills.com/~/media/Files/CorporateBrochure_090110_LowRez.ashx
The CompanySales Breakdown Source: General Mills Inc, Annual Report 2010 http://generalmills.com/~/media/Files/annual_report_2010.ashx
The CompanyGrowth Model • 5 Key Business Drivers: • Innovation • Brand Building • Customer Growth • International Expansion • Margin Expansion • Executed through: • Holistic Margin Management (HMM) • Cost cutting measure which ranges from consolidating purchases to give them more bargaining power to change of packaging for more efficient loading and unloading • Increased media and multicultural advertising • Recognizes the growing Hispanic population and the sales potential • R&D and Product innovations • New products like chocolate and multigrain varieties of Cheerio's
The CompanyGrowth Opportunities • Economic conditions favoring At-home Meals • Aligning products with growing US consumer groups • Baby boomers, millenials, and multicultural population • Emerging market expansion • Expanding operations in China, Brazil, India
The CompanyThe Future • Increase CapEx to ~$700 million in FY2011 • Increase manufacturing capacity for cereals and Yoplait yogurt • Expand International production capacity for Wanchai and Haagen Daz products • Continue HMM throughout supply chain • Targeting $1 Billion in savings through HMM in the next 3 years • Expects increase in energy and commodity prices • Makes use of hedging instruments to manage the fluctuation in input costs • Expects cost savings from HMM to offset rising COGS • Share repurchase program • Reduce outstanding shares by 2% every year
Recent Events • PAI is selling its 50% stake in Yoplait and GIS is the front runner • GIS has had franchise agreements with Yoplait since 1977 which is one of their top businesses • General Mills buys Mountain High Yogurt • Faces the risk of losing Yoplait because French Dairy Sodima (50% owner of Yoplait) wants to severe their licensing by 2012 • Rising food costs are pressuring food makers and retailers to pass on the costs to consumers • GIS expects input costs to rise 4%-5% in FY2011 • Recently raised prices on some cereal brands and baking products
The CompanyManagement Assessment • Regular dividends without reduction for 112 years • Dividend rate has been growing at 9% compound rate over past 4 years • Strength in efficiency and productivity • HMM discipline helps to keep COGS down even in times of inflation *Figures from General Mills Inc. 10-K FY 2010 Source: (1) General Mills Inc, Corporate Fact Sheet http://phx.corporate-ir.net/External.File?item=UGFyZW50SUQ9NjA4NzN8Q2hpbGRJRD0tMXxUeXBlPTM=&t=1
SWOT Analysis • Strength: • Strong brand equity on key brands • Growing international operations • Product development skills • Innovators • Brand management skills • Weakness: • Dependent on the US market for revenue • Rising SG&A expenses
SWOT Analysis • Opportunities: • Growing health consciousness • Higher penetration with smaller retailer customers in the U.S. • Rising demand for cereals • Threats: • Commodity price increases • Competitive market • Private label growth
STOCK PRICE CHART Source: Yahoo Finance
Key Ratios Source: Capital IQ Company Financials
Discount Rate Source: ◊ General Mills Inc. 10-K ; ◦ Capital IQ Company Financials
Comparable Analysis *Figures of comparables obtained from competing firms previously mentioned, and data is obtained from Capital IQ.
Recommendation Basis • Current Price: $35.45 (Nov-29-2010) • DCF Valuation: $26.17 (Negative) $35.93 (Base) $41.29 (Positive) • Relative Valuation: $21.50 - $36.24 • On Watch-List Since Dec 2009 - Underperformed both DJIA and S&P 500 - Underperformed relative to peers
Recommendation • We DO NOT recommend investing at this time • Keep in watch list. Look for other companies within the sector that match our investment policy • It’s a good company but not a great stock.