Download
1 / 1
10 likes | 186 Views
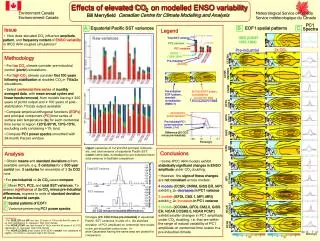
Effects of elevated CO 2 on modelled ENSO variability. Environment Canada Environnement Canada. Meteorological Service of Canada Service météorologique du Canada. Canadian Centre for Climate Modelling and Analysis. Bill Merryfield. PC1 Spectra. EOF1 spatial patterns. A. C. B.

E N D
Effects of elevated CO2 on modelled ENSO variability Environment Canada Environnement Canada Meteorological Service of Canada Service météorologique du Canada Canadian Centre for Climate Modelling and Analysis Bill Merryfield PC1 Spectra EOF1 spatial patterns A C B OBS (GISST 1955-1994) Raw variances 2x CO2 Pre-industrial 1 error bars Total SST variance CCCMA means PC2 variance PC1 variance CCSR MEDRES GISST (1955-1994) Pre-industrial 2x CO2 CNRM GFDL CM2.0 2x CO2 EOF1 pattern, normalized by Pre-industrial EOF1 pattern, standard normalization (RMS=1) ( ) 2X CO2 PC1 RMS Pre-industrial PC1 RMS GFDL CM2.1 2X CO2 PC1 power spectrum GISS EH Pre-industrial PC1 power spectrum (mean, 1) GISS ER Difference (2X CO2minus pre-industrial) 0.1 1 10 100 Analysis Period (yr) • Obtain means and standard deviationsfrom available sample, e.g. 5 centuries for a 500-year control run, 3 centuries for ensemble of 3 2x CO2 runs. • For pre-industrial vs 2x CO2 cases compare: IAP Total SST variance Number of models MPI ECHAM5 A Mean PC1, PC2, and total SST variances. To assess significance of 2x CO2minuspre-industrial differences, express in units of standard deviation of pre-industrial sample. B Spatial patterns of EOF1 C Variance-preservingPC1power spectra PC1 variance Number of models MRI 2XCO2 minus pre-industrial differences () NCAR CCSM3.0 NCAR PCM1 1 10 0.1 100 Period (yr) C C Equatorial Pacific SST variances Issue Legend • How does elevated CO2 influence ampitude, pattern, and frequency content of ENSO variability in IPCC AR4 coupled simulations? Methodology • For low CO2 climate consider pre-industrial control (picntrl) simulations. • For high CO2 climate consider first 100 years following stabilization at doubled CO2 in 1%to2x simulations. • Select centennial time series of monthly averaged data, with mean annual cycles and linear trends removed, from models having ≥ 200 years of picntrl output and ≥ 100 years of post-stabilization 1%to2x output available*. • Compute empirical orthogonal functions (EOFs)and principal component(PC)time series of surface skin temperature (ts) for each centennial time seriesin region 120E-90W, 10S-10N, excluding cells containing >1% land. • Compute PC1 power spectra smoothed with 24-month Parzen window Normalized Upper: variances of 1st and 2nd principal compone- nts, and total variance of equatorial Pacific SST. Lower: same data, normalized bypre-industrialmean total variance to facilitate comparison Conclusions • Some IPCC AR4 models exhibit statistically significant changes in ENSO amplitude under CO2 doubling. • However, the signs of these changes are not consistent across models: 4 models(CCSR, CNRM, GISS ER, IAP) exhibit > 2 decreases in PC1 variance 3 models (GFDL CM2.1, MPI, MRI) exhibit > 2 increasesin PC1 variance 5 models(CCCMA, GFDL CM2.0, GISS EH, NCAR CCSM3.0, NCAR PCM1) exhibit smaller changes in PC1 amplitude under CO2 doubling, i.e. that are within the range of natural variability of PC1 amplitude on centennial time scales in a pre-industrial climate. ~ ~ Changes (2XCO2 minus pre-industrial) in equatorial PacificSST variances in units of , the standard deviationof PC1 amplitude on centennial time scales in thepre-industrial control runs. 1- wide Gaussians having the same area are plotted for comparison. *exceptions: •ForGISS_ER and IAP uselast 20 years of 1%/yr and first 80 years of x2 CO2 stabilization torepresent high CO2 climate •ForNCAR_PCM1 uselast 4 years of 1%/yr and first 96 years of x2 CO2 stabilization torepresent high CO2 climate •ForNCAR_CCSM3_0 useyears 2100-2200 of sresb1 runs (stabilized at slightly < 2x CO2) torepresent high CO2 climate