Download
1 / 12
120 likes | 253 Views
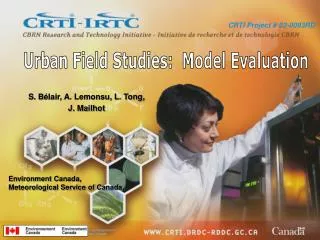
CRTI Project # 02-0093RD. Urban Field Studies: Model Evaluation. S. B élair, A. Lemonsu, L. Tong, J. Mailhot. Environment Canada, Meteorological Service of Canada,. Joint Urban 2003 Experiments. 15-km Regional model. IC + LBC. GEM-LAM 2.5 km. GEM-LAM 250 m.

E N D
CRTI Project # 02-0093RD Urban Field Studies: Model Evaluation S. Bélair, A. Lemonsu, L. Tong, J. Mailhot Environment Canada, Meteorological Service of Canada,
Joint Urban 2003 Experiments 15-km Regional model IC + LBC GEM-LAM 2.5 km GEM-LAM 250 m IC + LBC OKC TEB is used in 2.5 km, 1 km, and 250-m models IC + LBC GEM-LAM 1 km Incoming flow
Obs Urban Crops IOP6 (Daytime): Urban Heat Island (1-km Results) Rural Stations In red, PWIDS stations used for model verification TEB does not make much differences over rural areas (expected!) City Center Stations Heat Island Index Significant improvement in the city (cooler in the day, warmer in the night)
IOP6 (Daytime): Well-Mixed Layer (1-km Results) Not enough vertical resolution to capture the sharp inversion at the top of the well-mixed layer Model soundings are not sensitive to the inclusion of TEB. Hypothesis is that horizontal variability comes from meteorology
IOP9 (Night): Urban Heat Island 50-m Air Temperature Warm plume from the city OKC (valid at 0500 UTC)
IOP9 (Night): Shallow Quasi-Neutral Layer Norman (rural) OBS OBS OBS MODEL MODEL MODEL ANL (downwind) Urban soundings Neutral nocturnal layer is well captured by the model. But too warm (not due to city treatment, see sounding at Norman) PNNL (upwind)
IOP9 (Night): Daytime turbulence 1000-m Vertical Motion OKC Flow is quasi-laminar in the first portion of the domain (why we use a rectangular domain oriented along the low-level winds) (valid at 2100 UTC)
Montreal Urban Snow Experiments (MUSEs) MUSE-2005: 17 March to 14 April 2005 MUSE-2006: 10 February to 31 March 2006 OBJECTIVES • Document the evolution of surface characteristics and energy budgets in a dense urban area during the winter-spring transition • Evolution of snow cover from ~100% to 0% in an urban environment • Impact of snow on the surface energy and water budgets • Quantify anthropogenic heat fluxes in late winter and spring conditions • Evaluate the Town Energy Balance model (TEB) in reproducing the surface characteristics and budgets in these conditions • Gain expertise in urban measurements • Residential location: • Horizontally homogeneous • two and three-storey attached buildings • - Away from tall buildings and trees, rivers, mountains, parks 1 km
Measurements During MUSE-2005 Infrared camera Net radiometer 3D sonic anemometer H2O/CO2 analyzer Fine wire thermocouple Anemometer Temperature Humidity IOP: 26-h observing periods with manual measurements 20 m Albedo Snow depth Snow density Surfaces temperature Photographs 7 m Fine wire thermocouple Snow depth Tair Qair Twall Tair Qair Twall 4 m Temperature Humidity TRAILER Snow Snow FABRE STREET ALLEY Sidewalk Sidewalk Backyard Backyard Frontyard Frontyard In blue: continuous measurements Manual measurements were also taken on perpendicular street during IOP
An Interesting First Week of Measurements Solar Radiation Turbulent Fluxes As snow melts, there is a rapid decrease of albedo… … associated with an increase of the Bowen Ratio
0.4 0.4 0.3 0.3 Fraction (-) Fraction (-) 0.2 0.2 0.1 0.1 0.0 0.0 Parks Alleys Roads Borders Buildings Bld areas Sidewalks Backyards Vegetation Bld polygons Footprint Analysis Westerly Easterly Similar distributions of surface types over the westerly and easterly footprints. But other factors may influence the turbulent measurements (e.g., installation of instruments on the tower, which is optimal for southwesterly winds).
Energy Budget Analysis With snow No snow RN Residue RN Residue H H LE LE S S L L L S L S Residue = Storage + snow melt – Anthropogenic heat fluxes