Interpolation in Mathematics & Image Processing
Learn about interpolation, Lagrange polynomial, medical image processing, image interpolation, MATLAB examples, pixel intensity in images, and more.

Interpolation in Mathematics & Image Processing
E N D
Presentation Transcript
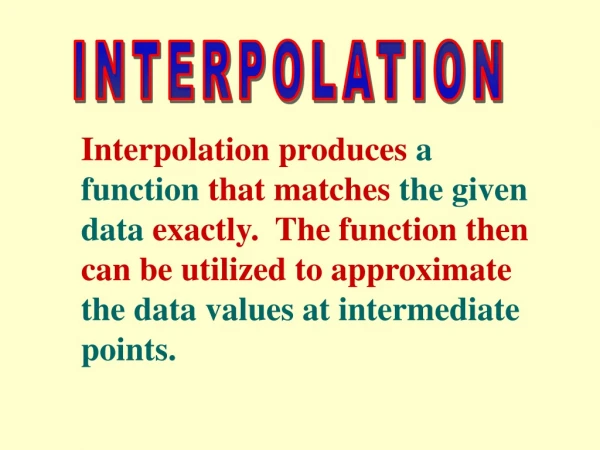
Interpolation It is the process of determining the value of a function at a point based on the known values at neighboring points. SCV-ASU
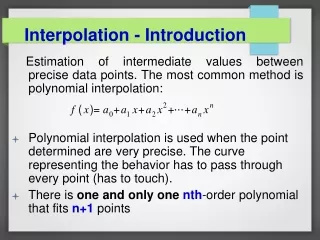
The Interpolating Polynomial The most compact representation of the interpolating polynomial is the Lagrange form: There are n terms in the sum and n-1 terms in each product, so the expression defines a polynomial of degree at most n-1. If we use four given points to find the data at a missing point the best estimate can come when all these points are used. In such a case we will have a 4th order polynomial as: SCV-ASU
Example - Interpolating Polynomial Consider the following three data points, find the value at x = 1. (x1 = 0, y1 = 2), (x2 = 3, y2 = 8) , and (x3 = 5, y3 = 12) Which means that the value of f(x) at the point x = 1, is 4. This is actually the exact answer as the three given data points were generated using f(x) = 2x + 2. And by substituting 1 in the formula, we get 4 as well. SCV-ASU
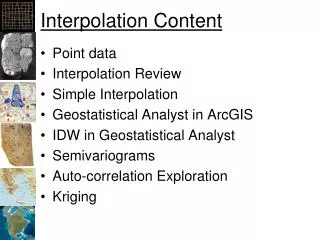
An Interesting Problem In medical image processing, we often use 2-D gray-scale images that are taken as a set of images at small distance apart. Below we have shown 6 of the slices of a 30 –image set of MRI brain images that are taken with about 15 mm distance separation. Often we are interested in viewing these images in 3-D. But for that to happen we really need many more images to correctly generate the 3-D view. One way to get more images is to interpolate using the existing slices and add additional images. The question is, which method of interpolation to use? For example, with a polynomial, what order of polynomial provide sufficient accuracy? SCV-ASU
An Interesting Problem – cont. • In MATLAB, you can read an image using: > f =imread(‘image.bmp’); You can display the image using: > imshow(f); You can use one of the three brain image sets at: www.cs.appstate.edu/~rt/ImgProc/images/MRI/BMP/eb www.cs.appstate.edu/~rt/ImgProc/images/MRI/BMP/es www.cs.appstate.edu/~rt/ImgProc/images/MRI/BMP/et SCV-ASU
MATLAB Example In MATLAB, there are several interpolation algorithms. Considering the same example: (x1 = 0, y1 = 2), (x2 = 3, y2 = 8) , and (x3 = 5, y3 = 12) > u = 1; > x = [0 3 5]; > y = [2 8 12]; > v = polyinterp (x, y, u) v = 4.0000 u can be an array of unknown points. interpgui interpgui(x,y) Other functions: v = piecelin(x, y, u) piecewise linear interpolation v = pchiptx(x, y, u) piecewise Cubic HermiteInterpolation v = splinetx(x, y, u) piecewise Spline Interpolation SCV-ASU
Solve this Example x y ------------------------------- -2.0000 -132.0000 -1.6000 -52.2573 -1.2000 -19.7850 -0.8000 -9.6230 -0.4000 -7.8707 0 -8.0000 0.4000 -7.1693 0.8000 -2.5370 1.2000 12.4250 1.6000 51.6173 2.0000 140.0000 What would be an answer at x = -0.2 x = 0.2 x = 1.8 y = 3*x.^5 + 5*x.^3 + 3*x.^2 - 8; SCV-ASU
More on the Project The building blocks of a gray scale image, are pixels. These pixels may have intensity values that represent different shades of gray. For example in a 4-bit image, each pixel may have a value between 0 to 24-1 = 15. In this image 0 represents the black color and 15 represent the maximum intensity value, which is for white color. Any number between 0 to 15 represents a shade of gray. Here is an example of 4- bit image that is of size 4-by-4. 10 11 13 15 0 1 5 8 3 10 7 4 3 7 6 13 SCV-ASU
More on the Project For two images of the same size, the average image can be obtained by adding the corresponding pixels and dividing them by 2. This is basically the same as using the first order polynomial in interpolating the image between the 2. Suppose A = 11 11 13 15 0 1 5 7 3 10 7 4 3 7 6 13 Suppose B = 1 3 11 13 4 7 9 3 3 10 7 6 5 9 12 11 • The Average = • 6 7 12 14 • 4 7 5 • 3 10 7 5 • 4 8 9 12 SCV-ASU