Download
1 / 13
130 likes | 224 Views
Dive into the motivations, observations, fetch conditions, corrections, and conclusions of regional flux studies at Cabauw with a focus on energy budgets and advection. Explore the surface energy imbalance, different flux levels, and tower-based observations.

E N D
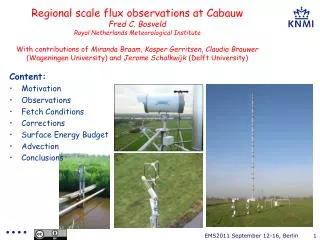
Regional scale flux observations at CabauwFred C. BosveldRoyal Netherlands Meteorological InstituteWith contributions of Miranda Braam, Kasper Gerritsen, Claudia Brauwer (Wageningen University) and Jerome Schalkwijk (Delft University) • Content: • Motivation • Observations • Fetch Conditions • Corrections • Surface Energy Budget • Advection • Conclusions EMS2011 September 12-16, Berlin 1
Consortium van 8 instituten: http://www.cesar-observatory.nl http://www.cesar-database.nl EMS2011 September 12-16, Berlin 2
Regional scale fluxes -> Motivation • Surface fluxes at the scale of atmospheric model gridcel • Surface fluxes at the scale of satellite pixel • Surface Energy budget closure studies • Evaluation of advection in models • Cabauw serves as reference case since it is relatively homogeneous and very flat EMS2011 September 12-16, Berlin 3
Flux levels 180 m 100 m 60 m 3 m Regional scale fluxes -> Observation Water budget of the polder Extra LArge Scintillometer (XLAS) over a 10 km path at 60 m height Cabauw 213 m meteorologival tower T,q, CO2 fluxes and concentrations Gill R3 sonic anemo/thermometer Licor 7500 H2O/CO2 sensor EMS2011 September 12-16, Berlin 4
180m 100m 60m XLAS 10 km 3m Tower Water Budget Regional scale fluxes -> Fetch conditions 2 km EMS2011 September 12-16, Berlin 5
N Sonic E Sonic B Regional scale fluxes->Corrections - Mast interference EMS2011 September 12-16, Berlin 6
Based on Kaimal (1972) surface layer spectra Extended by Schalkwijk et al (2010) 180 m 100 m 60 m 3 m Regional scale fluxes -> Corrections • - Standard corrections for eddy correlation technique • Density, Flow distortion, sensor seperation • High accuracy needed • Calibration issues • - Low frequency flux contribution • Extention of surface layer relations U = 5 m/s T=600 s EMS2011 September 12-16, Berlin 7
Regional scale fluxes -> Surface fluxes Surface flux Advective flux Storage flux Local flux EMS2011 September 12-16, Berlin 8
Regional scale fluxes -> Surface energy budget • Imbalance is independent • of height of flux • observation. • Mean diurnal variation of 8 comparable days • Surface total heat flux (THF=H+LE) estimated from different heights. • Available Energy (Qav=Qnet-G) EMS2011 September 12-16, Berlin 9
Surface and 60 m sensible heat fluxes No constant flux layer Deriving fluxes from XLASat 60 m height and 10 km path • No constant flux layer in the morning • ? Does CT2 at 60 m scales with: • Surface sensible heat flux (s) • Local sensible heat flux at 60 m (l) • Braam et al. (subm. BLM) CT2 from similarity functions with surface and local scaling, compared with CT2 derived directly from XLAS and from sonic at 60 m. EMS2011 September 12-16, Berlin 10
Regional scale fluxes -> Advection (Diurnal variation) Sensible heat flux April-June 2008 Difference in surface flux between 60 – 100 m and 100 – 180 m Some indication of higher local latent heat flux. CO2 Latent heat flux EMS2011 September 12-16, Berlin 11
60-100m 100-180m CO2 Regional scale fluxes -> Advection(Wind direction) Difference in surface flux between 60 – 100 m and 100 – 180 m April-June 2008 daytime 30 min values and wind direction class mean values Some signature visible Sensible heat flux Latent heat flux EMS2011 September 12-16, Berlin 12
Conclusions • The Cabauw 213 m meteorological tower gives a unique opportunity to perform tower based regional scale flux observations. • The site is flat and rather homogeneous. • Special care for low frequency flux loss correction • Surface energy imbalance independent of measuring height • Scaling of scintillometer at 60 m (outside constant flux layer) investigated • Slightly significant signals in advection found both in time of day and in wind direction. EMS2011 September 12-16, Berlin 13