Download
1 / 41
410 likes | 480 Views
Explore global educational exclusion rates and disparities based on poverty, location, gender, and disability. Discover strategies for inclusive education and empowering marginalized children.

E N D
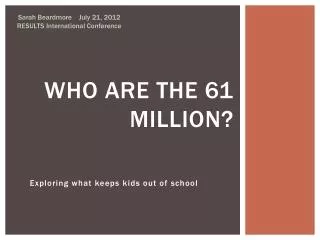
Who are the 61 million? Exploring what keeps kids out of school Sarah Beardmore July 21, 2012 RESULTS International Conference
How do we measure exclusion? • International comparison: which countries have the most out of school children? • Sub-national comparison: which groups of children – by gender, income, location – are excluded from school? • Educational life cycle: are children out of school because they never started school, because they are delaying entry or because they have dropped out? • Exclusion within school: Are children who attend school able to participate successfully in the learning-teaching process?
Exclusion: A growing challenge? Millions of children are not in school, and it is becoming increasingly clear that we will not achieve the Education for All Goals without focusing on the most marginalized. THE RATE OF PROGRESS IS DECLINING DUE TO: • the increasing difficulty of reaching children who face the most exclusion • population growth coupled with stable or sluggish rates of increase in school participation
Forty-year NER growth path Source: Data Centre (database), UNESCO Institute for Statistics, Montreal, http://www.uis.unesco.org.
UNDERSTANDING DISPARITIES: POVERTY • POVERTY: The most important dimension of educational exclusion. OOS children aged 6–11 who never participated based on lowest and highest income quintiles
UNDERSTANDING DISPARITIES: RURAL LOCATION • RURAL/URBAN: Disparities may be due to higher concentrations of poverty in rural areas, as well as low coverage of schools. • In Afghanistan, the attendance rates in rural areas fall by 16 percent for every mile that children must travel to school • Urban attendance rates are decreasing rapidly given that the urban areas of the world are absorbing the population growth • The most highly disadvantaged are the children of pastoralists in certain countries in Africa, including Burkina Faso, Cameroon, Cote D’Ivoire, Djibouti, Ethiopia and Somalia where school access barriers and low demand for schooling may contribute
UNDERSTANDING DISPARITY: gender Source: Data of DHS and MICS surveys.
UNDERSTANDING DISPARITY: GENDER Source: Data of DHS and MICS surveys.
Educational exclusion: the life cycle • Niger, 2006 Source: Data of DHS surveys. Note: The figure is based on age-specific attendance rates among children who are attending or who have ever attended school.
Exclusion within school On the basis of: • gender: stereotypes in materials and activities, gender-based violence, lack of latrines, classroom practice, etc. • Disability: inaccessible learning materials, lack of supports (eye glasses, wheelchairs etc.) • Minority status: mother tongue instruction; culturally relevant materials, etc. • Orphan status: stigma, etc.
Learn from what works • School fee elimination • Conditional cash transfers • School feeding programs • Access to early learning opportunities (pre-school) • Reform of classroom practice and learning supports • Community participation • Improve the supply of education for marginalized groups • Improve demand for education and understanding of education rights
The missing millions: education and disabled children
The basic facts • UNESCO estimate that one third of all out of school children live with a disability – this is over 20 million children • School completion and achievement rates are far lower for disabled children than their non-disabled peers • Eg in Indonesia in 2003 88.5% of non-disabled children were in school but only 29.2% of disabled children
Broader context • The WHO 2011 World Report on Disability found that 15% of the world’s population lives with a disability • Disabled people are disproportionately likely to be very poor – making up over 20% of those living on less than $1.25 a day • 80% of disabled people live in developing countries “Sustainable, equitable progress in the agreed global development agenda cannot be achieved without the inclusion of persons with disabilities. If they are not included, progress in development will further their marginalization.” - UNDG
What does this mean in practice? Anne Wafula Strike Shikuku Obosi
What can be done? Inclusive education: Accessible infrastructure and materials Teacher training and additional support Community awareness
Sightsavers in Mali “I am happy with the arrival of the project in UMAV. My two children were equipped with spectacles. They left the boarding school of the INAM [the National Institute of the Blind] and came back to their school. They were learning through Braille. Today they use large print and attend Faladie Socoura School, their former school. Their mother, sisters and brothers are very happy. I have bought a school table and a chair so that they can be near the blackboard. Now, my children take part to baptism, weddings, and circumcision ceremonies and feel fulfilled. '' Gaoussou TOURE, Parent of Low Vision children.
Donors and inclusive education • Most donors do not adequately consider disabled children in their development aid. • RESULTS 2010 report on UK Department for International Development found some good projects, but widespread neglect of the issue
United Nations Convention on the Rights of Persons with Disabilities • Article 24: Inclusive Education • Article 32: International Cooperation • Came into force in 2008 • Number of ratifications: 112 nations, including RESULTS countries Australia, Canada, Mexico, and UK. USA and Japan have signed but not ratified.
Expulsion of Pregnant Students in Tanzania and Out-of-School Children in Conflict-Affected and Fragile States Tony Baker RESULTS International Conference July 21st, 2012
Expulsion of Pregnant Students in Tanzania Tony Baker RESULTS International Conference July 21st, 2012
Poverty headcount ratio at $1.25 a day (PPP) World: 22% Sub-Saharan Africa: 48 % Tanzania: 68% World Bank eAtlas of Global Development and PovcalNet Tony Baker RESULTS International Conference July 21st, 2012
Girls enrollment in primary school (% net) World: 87% Sub-Saharan Africa: 73% Tanzania: 98% World Bank eAtlas of Global Development Tony Baker RESULTS International Conference July 21st, 2012
Ratio of female to male primary school enrollment World: 96% Sub-Saharan Africa: 92% Tanzania: 102% World Bank eAtlas of Global Development Tony Baker RESULTS International Conference July 21st, 2012
Persistence to last grade of primary school World: 93% Sub-Saharan Africa: 68% Tanzania: 81% World Bank eAtlas of Global Development and EFA GMR 2011 Tony Baker RESULTS International Conference July 21st, 2012
Basic Education Statistics in Tanzania, 2008-2010 Tony Baker RESULTS International Conference July 21st, 2012
Basic Education Statistics in Tanzania, 2008-2010 Tony Baker RESULTS International Conference July 21st, 2012
Basic Education Statistics in Tanzania, 2008-2010 Tony Baker RESULTS International Conference July 21st, 2012
Basic Education Statistics in Tanzania, 2008-2010 Tony Baker RESULTS International Conference July 21st, 2012
No legislation specifically provides for the expulsion of pregnant school girls. • Section 4(b) of G.N. No. 295 of the National Education Act 1995 (Cap. • 353 R.E. 2002) • 4. The expulsion of a pupil from a school may be ordered where – • The persistent and deliberate misbehavior of the pupil is such as to endanger the general discipline or the good name of the school or; • The pupil has committed a criminal offence such as theft, malicious injury to property, prostitution, drug abuse or an offence against morality whether or not the pupil is being or has been prosecuted for that offence; • A pupil has entered into wedlock. Tony Baker RESULTS International Conference July 21st, 2012
Basic Education Statistics in Tanzania, 2008-2010 Tony Baker RESULTS International Conference July 21st, 2012
Section 13 of the Constitution of the United Republic of Tanzania of 1977 13.- (1) All persons are equal before the law and are entitled, without any discrimination, to protection and equality before the law. (2) No law enacted by any authority in the United Republic shall make any provision that is discriminatory either of itself or in its effect. … (5) For the purposes of this Article the expression “discriminate” means to satisfy the needs, rights or other requirements of different persons on the basis of their nationality, tribe, place of origin, political opinion, colour, religion, sex or station in life such that certain categories of people are regarded as weak or inferior and are subjected to restrictions or conditions whereas persons of other categories are treated differently or are accorded opportunities or advantage outside the specified conditions or the prescribed necessary qualifications. Tony Baker RESULTS International Conference July 21st, 2012
Tony Baker RESULTS International Conference July 21st, 2012
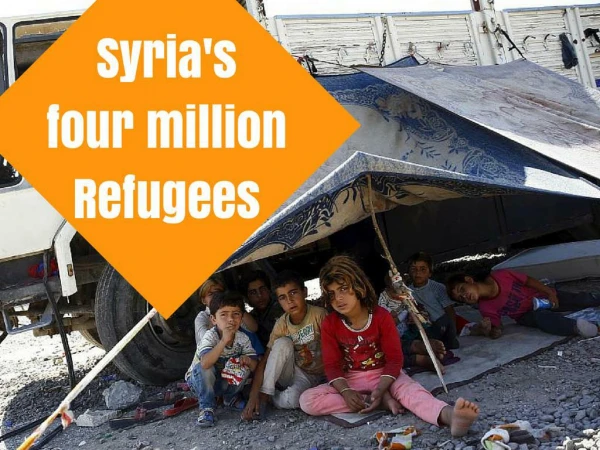
Out-of-School Children in Conflict-Affected and Fragile States Tony Baker RESULTS International Conference July 21st, 2012
Tony Baker RESULTS International Conference July 21st, 2012
38 mil (62%) of 61 mil OOS are in CAFS 23 mil (74%) of 31 mil OOS in SSA are in CAFS Tony Baker RESULTS International Conference July 21st, 2012
Impacts on education Dropouts, low attendance Interrupted education / Lost years of schooling Amplified inequalities : Disproportionate impact on poor and girls No fragile or conflict affected country has yet achieved a single MDG. Tony Baker RESULTS International Conference July 21st, 2012
Unique contributions of conflict and fragility to negative impacts on education Damage of school infrastructure Sexual violence Recruitment of child soldiers and abduction Displacement Diversion of resources EFA GMR 2011 Tony Baker RESULTS International Conference July 21st, 2012
Tony Baker RESULTS International Conference July 21st, 2012
Thanks Tony Baker RESULTS International Conference July 21st, 2012