Download
1 / 30
300 likes | 424 Views
Global change Examiner: Bertil Dynefors Guest lecturers: Jee-Hoon Jeong Johan Mellqvist From Atm science centre Lecturs of 2 or 3 hours according to schedule. Examination: Main examination. - three packages of homework the last one far more extensive than the others.

E N D
Global change Examiner: Bertil Dynefors Guest lecturers: Jee-Hoon Jeong Johan Mellqvist From Atm science centre Lecturs of 2 or 3 hours according to schedule. Examination: Main examination. - three packages of homework the last one far more extensive than the others. Additional examination - short written examination of 2 hours on Nov 4
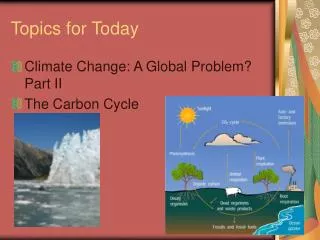
Topics of the course: • The concept and meaning of Global change. • Air pollutants. Example: carbon monoxide • Soil acidification • The stratosphere and global change • Permafrost • Solar winds and climate change • Clouds or terrestrial responses • Guest lectures • radiation and atmosphere • aerosols and climate • climate modelling Hemsida:http://fy.chalmers.se/~funbd/GC/GC-11-index.htm check also GUL
Global change and international operators • How do weidentify and confirm Global changes? • How do we find out the consequences of Global changes? • Who is responsible to take actions due to global changes? In this course ”Global change” is a change in the natural system, atmosphere, land, sea. We also mean such changes which are caused by anthropogenic activities and are of detrimental effects on health or environment.
Toward global attention • Suppose that a situation we study will be of global concern. • To whom do we turn? • Maybe, after a while, to the national environmental protection agency. They most certainly will ask: what is your evidences of changes and what is the evidences of negative effects of the changes. • If you are successful, your supposition can reach the inernational level and international organizations. Which are they?
UN UNEP (United Nations Environment programme) WHO (World Health Organization)OECD– on the relation betweeneconomy and environmentSomerich and developedcountrieshaveorganizations of global range like- US with its EPA- EU with itscorrespondning EEA( European environment agency)What is the authorization of theseorganizations?
One of UNEP’s main functions since its inception at the Stockholm Conference on the Human Environment in 1972 is to keep under review the world environmental situation, as mandated by UN General Assembly resolution 2997 (XXVII). By carrying out this function, UNEP is to ensure that emerging environmental problems of wide international significance receive appropriate and adequate considerations by Governments.
DEWA The Division of Early Warning and Assessment (DEWA) provides timely, scientifically credible, policy-relevant environmental analyses, data and information for decision-making and action planning for sustainable development. It monitors, analyzes and reports on the state of the global environment, assesses global and regional environmental trends and provides early warning of emerging environmental threats. Working through five sections at headquarters in Nairobi and six regional offices, DEWA also maintains an office at the UNEP World Conservation Monitoring Centre (UNEP - WCMC) in Cambridge, UK and administers the Secretariat for the United Nations Committee on the Effects of Atomic Radiation (UNSCEAR) in Vienna, Austria The Division works closely with a large number of partners and collaborating centres in all regions of the world and has established functional networks for data, information, assessments and capacity development. Science is at the foundation of UNEP’s work and its Science Strategy aims to lay out a clear pathway for strengthening this cornerstone in the service of member states and to reinforce its work on the science-policy interface.
ABOUT GEO Keeping the global environment under review Global Environment Outlook (GEO) is a consultative, participatory process that builds capacity for conducting integrated environmental assessments for reporting on the state, trends and outlooks of the environment. GEO is also a series of products that informs environmental decision-making and aims to facilitate the interaction between science and policy. The rigorous assessment process aims to make GEO products scientifically credible and policy relevant - providing information to support environmental management and policy development. GEO also supports multi-stakeholder networking and intra and inter-regional cooperation to identify and assess key priority environmental issues at the regional levels.
EU Environment Protecting, preserving and improving the world around us The EU has some of the highest environment standards in the world, developed over decades to address a wide range of issues. Today the main priorities are combating climate change, preserving biodiversity, reducing health problems from pollution and using natural resources more responsibly.
Priority tasks by the international organizations, when they are paid attention to a possible Global change • To measure and observe. To built up a monitoring system. • To verify and establish possible health and environmental effects. • To propose standards and try to enact legislation
Increasing global divergence in population trends — global megatrend 1 Living in an urban world — global megatrend 2 Disease burdens and the risk of new pandemics — global megatrend 3 Accelerating technological change: racing into the unknown — global megatrend 4 Continued economic growth? — global megatrend 5 From a unipolar to a multipolar world — global megatrend 6 Intensified global competition for resources — global megatrend 7 Decreasing stocks of natural resources — global megatrend 8 Increasingly severe consequences of climate change — global megatrend 9 Increasing environmental pollution load — global megatrend 10 Environmental regulation and governance: increasing fragmentation and convergence — global megatrend 11
climate change stratospheric ozone forest clearance and land cover changes Global changes land degradation and desertification wetland loss and damages biodiversity loss freshwater depletion and contamination urbanization and its impact damage to coastal reefs and ecosystems
Air pollution • Indoor air pollution is estimated to cause approximately 2 million premature deaths per year. Half due to pneumonia in children under 5 years of age. • Outdoor air pollution is estimated to cause 1,3 million deaths per year.
What is an air pollutant? There are hundreds, maybe thousands of polluting gases in the atmosphere. Further there are plenty of different aerosol particles. The pollutants can be homogenously distributed in the atmosphere or it can be variation in mixing ratios as function of time and space. Effects are usually stated in terms of influence on human health or on the environment. Let us study a specific air pollutant and illustrate some general problems with this specific example.
Carbon monoxide as an example of global change air pollutant. Concentrations in Gothenburg the last seven days.
CO concentrations Göteborg January 2011 Carbon monoxide, CO Femman Haga Mob Average value 326 447 294 Diurnal peak value 626 1049 804 Highest hourly average 1273 2304 1700 Highest 8‐hours average 1021 1847 1210 98%‐il 8‐hours 808 1340 871
Typical CO concentrations • 0,1 ppm natural atmosphere level • 0,5-5 ppm average levels in homes • 5-15 ppm modern vehicle exhaust emission • 100-200 ppm exhaust Mexico city • 5000 ppm exhaust from wood fire • 7000 ppm exhasut from car without catalytic converter
Oktober 2009 CO-concentration Januari 2010 CO-concentration Mars 2010 CO-concentration
In Europe, emissions of many air pollutants have fallen substantially since 1990, resulting in improved air quality over the region. However, since 1997, measured concentrations of particulate matter and ozone in the air have not shown any significant improvement despite the decrease in emissions.
Table 3-1. Summary of Major Sources and Sinks of Carbon Monoxide Sources and Sinks Notes Sources Fossil fuel combustion Transportation and coal, oil, and natural gas burning Biomass burning Agricultural clearing, wood and refuse burning, and forest fires Methane (CH4) oxidation Wetlands agriculture (rice cultivation, animal husbandry, and biomass burning), landfills, coal mining, and natural gas and petroleum industry Non-methane hydrocarbon Transportation (alkanes, alkenes, and aromatic compounds) (NMHC) oxidation and vegetation (isoprene and terpenes) Organic matter oxidation Humic and other organic substances in surface waters and soils Vegetation Metabolic by-product Sinks Reaction with OH radicals Hydroxyl radicals are ubiquitous scavengers of many atmospheric pollutants. Soil microorganisms Responsible microorganisms still need to be cataloged.
The tropospheric burden of carbon monoxide, like that of many other trace gases, has been increasing due to man’s activities, although its upward trend ceased around 1995. Average CO abundances for the NH and SH are approximately 110 and 60 nmole/mole (ppb). The lifetime of CO is on the order of a few months only, and its significance in atmospheric chemistry lies mainly in its competition with many other gaseous pollutants—importantly the greenhouse gas CH4—for the hydroxyl radical (OH, CO + OH → CO2 + H). Increased CO emissions cause higher CO burdens and more reaction with OH, leaving less OH for cleansing the troposphere of other reduced gases. In the background troposphere, about one third of all OH is removed by CO that reacts rapidly with OH (contributing to the latter’s very short lifetime of 1 second only). Until recently, we were mostly informed about tropospheric CO concentrations via surface measurements. Now, results from remote sensing and an increasing number of aircraft flights give improved global coverage and some vertical resolution. Since the launch of the MOPITT satellite instrument, followed by SCIAMACHY, AIRS and others, we have a much better picture of large scale continental pollution plumes. The vertical resolution of satellite based remote sensing is limited to several km at best, and vertical profiles coordinated with satellite overpasses are needed to better define vertical variability. Before the satellite, surface and aircraft measurements are combined, their relative calibration must be accurately determined.
Health effects of CO The Administrator of EPA concluded that cardiovascular effects, as measured by decreased time to onset of angina pain and by decreased time to onset of significant electrocardiogram (ECG) ST-segment depression, were the health effects of greatest concern to be clearly associated with CO exposures at levels observed in the ambient air. These effects were demonstrated in angina patients at postexposure COHb levels that were elevated to 2.9 to 5.9% (CO-Oximetry [CO-Ox] measurement), representing incremental increases of 1.5 to 4.4% from baseline levels. Time to onset of significant ECG ST-segment change, which is indicative of myocardial ischemia in patients with documented coronary artery disease and a more 1-4 objective indicator of ischemia than angina pain, provided supportive evidence of health effects occurring at exposures as low as 2.9 to 3.0% COHb (CO-Ox). The clinical importance of cardiovascular effects associated with exposures to CO resulting in COHb levels less than 2.9% remains less certain and was considered only in evaluating whether the current CO standards provide an adequate margin of safety.
Mechanisms of Action for CO The principle cause of CO toxicity is tissue hypoxia caused by CO binding to hemoglobin (Hb) and failure of vasodilation to compensate for the reduced oxygen delivery. Secondary mechanisms related to intracellular uptake of CO have been the focus of recent research. Current knowledge summarized in this document suggests that the most likely protein other than Hb to be inhibited functionally at relevant levels of COHb is myoglobin, found in heart and skeletal muscle. The extent of effects caused by CO molecules in solution needs to be evaluated in relation to typical ambient CO exposures in the population. Other mechanisms of interest, which have not yet been demonstrated to occur at ambient CO levels, are cytotoxic effects (e.g., vasomotor control, free oxygen radicals) independent of impaired oxygen delivery.
On April 30, 1971, EPA promulgated identical primary and secondary NAAQS for CO at levels of 10 mg/m3 (9 ppm) for an 8-h average and 40 mg/m3 (35 ppm) for a 1-h average, not to be exceeded more than once per year. On August 18, 1980, EPA proposed changes to the standard (Federal Register, 1980) based on the findings of the revised criteria. The proposed changes included (1) retaining the 8-h primary standard level of 9 ppm, (2) revising the 1-h primary standard level from 35 ppm to 25 ppm, On August 1, 1994, EPA issued a final decision (Federal Register, 1994) that revisions of the NAAQS for CO were not appropriate at that time.
Air pollution The U.S. Environmental Protection Agency (EPA) promulgates the National Ambient Air Quality Standards (NAAQS) on the basis of an up-to-date compilation of scientific knowledge about the relationship between various concentrations of ambient air pollutants and their adverse effects on man and on the environment.