Download
1 / 12
130 likes | 371 Views
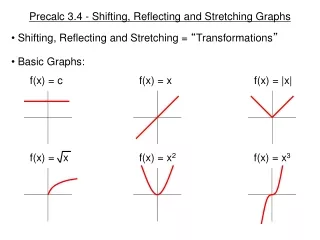
Shifting of Graphs Transformation. Vertical Shifting. Example 1. Below is the graph of a function y = f ( x ). Sketch the graphs of y = f ( x ) + 1 b) y = f ( x ) - 2. y = f(x) + 1. y = f (x). y = f (x)-2. Horizontal Shifting. Continued …. Example 2.

E N D
Shifting of Graphs Transformation
Vertical Shifting Example 1 • Below is the graph of a function y = f ( x ). Sketch the graphs of • y = f ( x ) + 1 • b) y = f ( x ) - 2 y = f(x) + 1 y = f (x) y = f (x)-2
Horizontal Shifting Continued… • Example 2. • Given the graph of a function • y = f ( x ). Sketch the graphs of • y = f ( x + 3 ) • b) y = f ( x – 4 ) y = f ( x ) y = f ( x + 3) Horizontal Shift 3 units to the left y = f ( x ) y = f ( x - 4) Horizontal Shift 4 units to the right
Continued… Can you tell the effects on the graph of y = f ( x ) Left h units and Up k units Lefth units and Down k units Righth units and Up k units Right h units and Down k units Example 3 Below is the graph of a function y = f ( x ). Sketch the graph of y = f ( x + 2 ) - 1 y = f( x + 2 ) - 1 y = f( x )
Example 4 Continued… Below is the graph of a function . Sketch the graph of Solution: The graph of the absolute value is shifted 2 units to the right and 3 units down y = f( x ) y =f(x-2)-3
Example 5 • If the point P is on the graph of a function f. Find the corresponding point on the graph of the given function. • P ( 0, 5 ) y = f( x + 2 ) – 1 • P ( 3, -1 ) y = 2f(x) +4 • 3) P( -2,4) y = (1/2) f( x-3) + 3 • P ( 0,5). y = f( x + 2 ) – 1 shifts x two units to the left and shifts y one unit down. The new x =0 – 2 = -2, and the new y = 5 – 1 = 4. The corresponding point is ( -2, 4 ). • 2) P(3,-1). y = 2f(x) +4 has no effect on x. But it doubles the value of y and shifts it 4 units vertically up. Therefore the new x = 3(same as before ), and the new value of y = 2 (-1 ) + 4 = 2. Therefore, the corresponding point is ( 3,2 ). • P(-2, 4 ). y = (1/2) f( x-3) + 3 shifts x 3 units to the right and splits the value of y in half and then shifts it 3 units up. That is, the new value of • y = (1/2)(4) + 3 = 5. Therefore, the corresponding point is ( 1, 5 ). Solution:
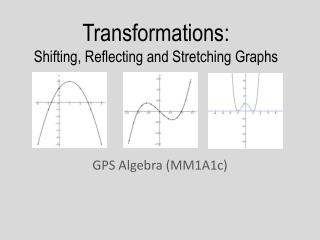
Reflecting a graph through the x-axis Note: For any point P(x,y) on the graph of y = f(x), The graph of y = - f(x) does not effect the value of x, but changes the value of y into - y Example 6 • Below is the graph of a function y = x2 . Sketch the graph of • y = - x2 Example 11
Vertical Stretching Note1 :When c > 1. Then 0 < 1/c < 1 Note 2 : c effects the value of y only. Example 7 • Below is the graph of a function y = x2 . Sketch the graphs of • y = 5 x2 • 2. y = (1/5)x2
Sketching a piece-wise function Definition: Piece-wise function is a function that can be described in more than one expression. Example 8 Sketch the graph of the function f if Solution: Graph y = 2x + 5 and take only the portion to the left of the line x = -1. The point (-1, 3 )is included. Graph y = x2and take only the portion where –1 < x < 1. Note: the points ( -1,1) and ( 1, 1 ) are not included Graph y = 2 and take only the portion to the right of x = 1. Note: y = 2 represents a horizontal line. The point (1, 2 ) is included.
Sketching the graph of an equation containing an absolute value Note: To sketch an absolute value function . We have to remember that And hence, the graph is always above the x-axis. The part of the graph that is below the x-axis will be reflected above the x-axis. Example 9 Sketch the graph of y = g ( x ) = Solution: Strategy: 1. Graph y = f(x) = x2. 2. Graph y = f( x ) - 9 = x2 – 9 by shifting the graph of f 9 units down 3. Graph g(x) by keeping the portion of the graph y = f( x ) - 9 = x2 – 9 which is above the x-axis the same, and reflecting the portion where y < 0 with respect to the x-axis. 4. Delete the unwanted portion
Example 10 Below is the graph of y = f(x). Graph Solution: A picture can replace 1000 words Let the animation talk about itself