Download
1 / 14
140 likes | 235 Views
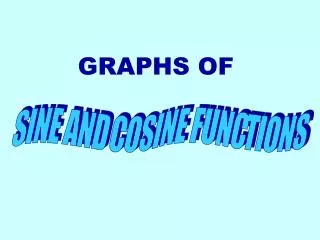
GRAPHS OF. S I N E A N D C O S I N E F U N CT I O N S. Here is the graph y = f ( x ) = sin x showing from -2 to 6 . Notice it repeats with a period of 2 . 2 . 2 . 2 . 2 . It has a maximum of 1 and a minimum of -1 (remember that is the range of the sine function).

E N D
GRAPHS OF S I N E A N D C O S I N E F U N CT I O N S
Here is the graph y = f(x) = sin x showing from -2 to 6. Notice it repeats with a period of 2. 2 2 2 2 It has a maximum of 1 and a minimum of -1 (remember that is the range of the sine function)
Thinking about transformations that you learned and knowing whaty = sin xlooks like, what do you supposey = sin x + 2looks like? This is often written with terms traded places so as not to confuse the 2 with part of sine function y = 2 + sin x The function value (or y value) is just moved up 2. y = sin x
Thinking about transformations that you've learned and knowing whaty = sin xlooks like, what do you supposey = sin x - 1 looks like? y = sin x The function value (or y value) is just moved down 1. y = - 1 + sin x
Thinking about transformations that you learned and knowing whaty = sin xlooks like, what do you supposey = sin(x + /2) looks like? y = sin x This is a horizontal shift by - /2 y = sin(x + /2)
Thinking about transformations that you learned and knowing whaty = sin xlooks like, what do you supposey = - sin(x )+1 looks like? y = 1 - sin(x ) This is a reflection about the x axis (shown in green) and then a vertical shift up one. y = - sin x y = sin x
Here is the graph y = f(x) = cos x showing from -2 to 6. Notice it repeats with a period of 2. 2 2 2 2 It has a maximum of 1 and a minimum of -1 (remember that is the range of the cosine function)
y = - cos x y = cos x y = 3 - cos (x - /4) y = 3 - cos x You could graph transformations of the cosine function the same way you've learned for other functions. moves right /4 moves up 3 Let's try y = 3 - cos (x - /4) reflects over x axis
What would happen if we multiply the function by a constant? All function values would be twice as high y = 2 sin x amplitude is here amplitude of this graph is 2 y = 2 sin x y = sin x The highest the graph goes (without a vertical shift) is called the amplitude.
For y = A cos x and y = A sin x, A is the amplitude. What is the amplitude for the following? y = 4 cos x y = -3 sin x amplitude is 3 amplitude is 4
The last thing we want to see is what happens if we put a coefficient on the x. y = sin 2x y = sin 2x y = sin x It makes the graph "cycle" twice as fast. It does one complete cycle in half the time so the period becomes .
What do you think will happen to the graph if we put a fraction in front? y = sin 1/2 x y = sin x The period for one complete cycle is twice as long or 4
The period T = So if we look at y = sin x the affects the period. This will be true for cosine as well. What is the period of y = cos 4x? y = cos x This means the graph will "cycle" every /2 or 4 times as often y = cos 4x
absolute value of this is the amplitude Period is 2 divided by this