Download
1 / 40
400 likes | 530 Views
Graphs of Functions. Lesson 3. Warm Up – Perform the Operations and Simplify. Solution. Solution. Solution. Solution. Domain & Range of a Function. What is the domain of the graph of the function f?. Domain & Range of a Function. What is the range of the graph of the function f?.

E N D
Graphs of Functions Lesson 3
Domain & Range of a Function What is the domain of the graph of the function f?
Domain & Range of a Function What is the range of the graph of the function f?
Let’s look at domain and range of a function using an algebraic approach. • Then, let’s check it with a graphical approach.
Find the domain and range of • Algebraic Approach The expression under the radical can not be negative. Therefore, Domain Since the domain is never negative the range is the set of all nonnegative real numbers.
Find the domain and range of • Graphical Approach
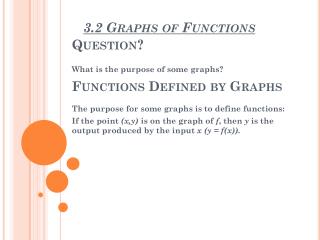
The more you know about the graph of a function, the more you know about the function itself. • Consider the graph on the next slide.
Falls from x = -2 to x = 0. Is constant from x = 0 to x = 2. Rises from x = 2 to x = 4.
Ex: Find the open intervals on which the function is increasing, decreasing, or constant. Increases over the entire real line.
Ex: Find the open intervals on which the function is increasing, decreasing, or constant.
Ex: Find the open intervals on which the function is increasing, decreasing, or constant.
The point at which a function changes its increasing, decreasing, or constant behavior are helpful in determining the relative maximum or relative minimum values of a function.
Approximating a Relative Minimum • Example: Use a GDC to approximate the relative minimum of the function given by
Put the function into the “y = “ the press zoom 6 to look at the graph. • Press traceto follow the line to the lowest point.
Example • Use a GDC to approximate the relative minimum and relative maximum of the function given by
Solution Relative Minimum (-0.58, -0.38)
Solution Relative Maximum (0.58, 0.38)
Because of the vertical jumps, the greatest integer function is an example of a step function.
Sketch the graph of Let’s graph a Piecewise-Defined Function Notice when open dots and closed dots are used. Why?
Algebraically Let’s look at the graphs again and see if this applies.
Graphically ☺ ☺
Example • Determine whether each function is even, odd, or neither.
Graphical – Symmetric to Origin Algebraic
Algebraic Graphical – Symmetric to y-axis
You Try • Is the function • Even, Odd, of Neither?
Solution Symmetric about the y-axis.