Download
1 / 1
30 likes | 244 Views
Teaching Data Visualization. Gabrielle Annala gannala@luc.edu Sarah Morris smorris4@luc.edu. CLASSROOM All students are working with the same assignment/data and have to meet a specific set of criteria to complete assignment objectives.

E N D
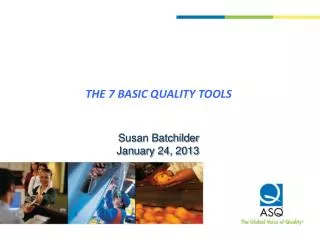
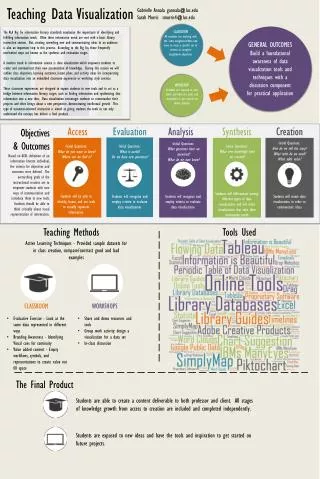
Teaching Data Visualization Gabrielle Annala gannala@luc.edu Sarah Morris smorris4@luc.edu • CLASSROOM • All students are working with the same assignment/data and have to meet a specific set of criteria to complete assignment objectives. The ALA Big Six information literacy standards emphasize the importance of identifying and fulfilling information needs. Often these information needs are met with a basic library instruction session. But, creating something new and communicating ideas to an audience is also an important step in this process. According to the Big Six, these frequently overlooked steps are known as the synthesis and evaluation stages. A modern trend in information science is data visualization which empowers students to create and communicate their new accumulation of knowledge. During this session we will outline class objectives, learning outcomes, lesson plans, and activity ideas for incorporating data visualization into an embedded classroom experience or workshop style seminar. These classroom experiences are designed to expose students to new tools and to act as a bridge between information literacy stages, such as finding information and synthesizing that information into a new idea. Data visualization encourages students to contextualize their projects and often brings about a new perspective, demonstrating intellectual growth. This type of outcomes-oriented instruction is aimed at giving students the tools to not only understand the concept, but deliver a final product. • GENERAL OUTCOMES • Build a foundational awareness of data visualization tools and techniques with a discussion component for practical application • WORKSHOP • Students are exposed to new ideas and have the tools and inspiration to get started on future projects Access Evaluation Analysis Synthesis Creation Objectives & Outcomes Initial Questions: How do we tell the story? What tools do we need? What adds value? Initial Questions: What questions have we answered? What do we now know? Initial Questions: What new knowledge have we created? Initial Questions: What is useful? Do we have new questions? Initial Questions: What do you want to know? Where can we find it? Based on ACRL definition of an information literate individual, five criteria for objectives and outcomes were defined. The overarching goals of the instructional sessions are to empower students with new ways of communication and introduce them to new tools. Students should be able to think critically about visual representation of information. Students will differentiate among different types of data visualizations and will select visualizations that suits their information needs Students will be able to identify, locate, and use tools to visually represent information. Students will recognize and employ criteria to evaluate data visualizations Students will recognize and employ criteria to evaluate data visualizations Students will create data visualizations in order to communicate ideas Teaching Methods Tools Used Active Learning Techniques - Provided sample datasets for in class creation, compare/contrast good and bad examples • CLASSROOM • WORKSHOPS • Evaluative Exercise - Look at the same data represented in different ways • Branding Awareness - Identifying Visual cues for continuity • Value added content - Empty workflows, symbols, and representations to create value not fill space • Share and demo resources and tools • Group work activity: design a visualization for a data set • In-class discussion The Final Product Students are able to create a content deliverable to both professor and client. All stages of knowledge growth from access to creation are included and completed independently. Students are exposed to new ideas and have the tools and inspiration to get started on future projects.