Download
1 / 27
270 likes | 388 Views
Join us for an engaging session on hierarchical networks using the Sci2 Tool and the OSLOM algorithm. We will explore the Blondel community detection algorithm and circular hierarchy visualizations, demonstrating how they efficiently handle edge directions, weights, overlapping communities, and hierarchies. Learn how to work with real datasets, including co-author networks by renowned network scientists. Gain practical skills in community detection while navigating the complexities of network science tools. Download Sci2 and prepare for an interactive experience!

E N D
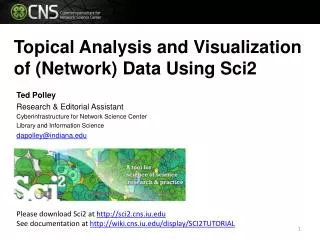
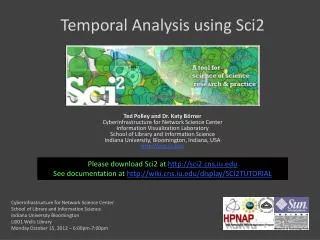
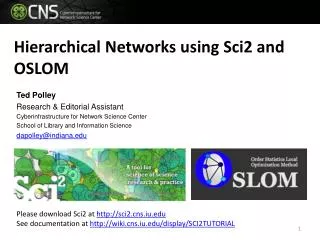
Hierarchical Networks using Sci2 and OSLOM Ted Polley Research & Editorial Assistant Cyberinfrastructure for Network Science Center School of Library and Information Science dapolley@indiana.edu Please download Sci2 at http://sci2.cns.iu.edu See documentation at http://wiki.cns.iu.edu/display/SCI2TUTORIAL
In this hands-on session we will introduce the Blondel community detection algorithm and the circular hierarchy network visualization. We will also look at the multifunctional algorithm package OSLOM (www.oslom.org) that handles edge directions, edge weights, overlapping communities, and hierarchies.
Blondel Community Detection • Works based on modularity optimization • Modularity is measured by looking at the density of edges inside communities versus the density of edges between communities • Highly scalable – detecting communities in a 118 million node network took 152 minutes1 1Blondel, V.D., Guillaume, J.-L., Lambiotte, R., & Lefebvre, E. (2008). Fast unfolding of communities in large networks. Journal of Statistical Mechanics: Theory and Experiment, 2008(10), P10008. Doi: 10.1088/1742-5468/2008/10/P10008
Blondel Community Detection • Algorithm works in two phases • First phase: each node is assigned to a community, modularity is calculated by examining each node and its neighbors, and this process repeats until all nodes are assigned to communities with the highest modularity possible • Second phase: each of the communities identified in the first phase are treated as nodes in network • This process iterates and the number of communities decrease with each level
Blondel Community Detection Let’s examine communities of authors in the fourNetSciResearchers.isi file. This dataset contains 361 publications spanning 52 years. It includes publications from four network scientists: Albert-László Barabási, Eugene Garfield, Alessandro Vespignani, & Stanley Wasserman. This data was collected in 2007 from Web of Science. In Sci2…
Blondel Community Detection In Sci2 run ‘File > Load’ and load the fourNetSciResearchers.isi file in the sci2\sampledata\scientometrics\isi directory…
Blondel Community Detection Make sure to load the file in the “ISI flat format”…
Blondel Community Detection Next, extract a co-author network by running ‘Data Preparation > Extract Co-Author Network’ and selecting the “isi” file format
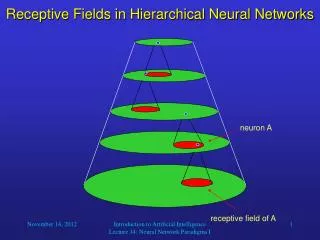
Blondel Community Detection • Each ring around the network indicates a level in the hierarchy. In the pervious visualization there are three levels: community_level_0(inner-most ring), community_level_1, and community_level_2 (outer-most ring) • Each mark on the rings indicates a community and corresponds, in this case, to the authors names who belong in that community. You can see at community_level_0, there are 21 communities • This structure allows you to see sub-communities within larger communities and conveys the hierarchical structure of this data
OSLOM • OSLOM (Order Statistics Local Optimization Method) • First method capable of handling directed networks, edge weights, overlapping communities, hierarchical data structure, and community dynamics • Get OLSOM here http://olsom.org. You will have to extract the directory from the OLSOM2.tar.gz • You will have to compile the OSLOM code in a Unix (MAC) terminal (if you are using Windows, you can try to use MinGW, Minimalist GNU for Windows)
OSLOM In order to get data into a format to be processed by OSLOM, you need to save out the edge list from Sci2 Run ‘File > Split Graph to Node and Edge Files’
OSLOM Right-click on the “Edge Table from Graph” file in the data manager and select view, which will open the file in Excel…
OSLOM You will need to remove the “number_of_coauthored_works” column since it is the same as the weight column. Then you should remove the top row because OSLOM will not be able to parse these string values. You should save the file as a text (.txt) file in you OLSOM2 directory. Before you can use it with OSLOM you will need to change the .txt extension to .dat
OSLOM First, you will need to move into the OSLOM directory, this can be done by using the change directory command (cd) and entering the path to the OSLOM2 folder. Note, here it has been done in two steps here, but it can be done in one.
OSLOM Next, you need to compile the OSLOM code. Type in: ./compile_all.sh
OSLOM Now you need to run OSLOM on the network you saved in the OSLOM2 folder from Sci2. Type the following command: ./oslom_undir -f <whatever you named the file.dat> -w
OSLOM Next, you will need to write a Pajek file for network after the communities have been identified. Type in the following command: ./pajek_write_undir <whatever you named the file.dat>
OSLOM A folder will be created in the OSLOM2 folder:
OSLOM In this folder you will find the Pajek files, one for each level of the hierarchy in the network:
OSLOM Load this file in Pajek (you can also load it in Gephi):
OSLOM Then to draw the network, run ‘Draw > Network’
OSLOM The network should automatically layout like this. To see the color go to ‘Options > Colors > Vertices > As Defined on Input File’ The black nodes indicate these nodes belong to overlapping communities and the white nodes do not belong to any community
Further Reading OSLOM Paper: Lancichinett, A., Radicchi, F., Ramasco, J.J., & Fortunato, S. (2010). Finding statistically significant communities in netowrks. PLoS One, 6(4), e18961. Doi: 10.1371/journal.pone.0018961 Blondel Paper: Blondel, V.D., Guillaume, J.-L., Lambiotte, R., & Lefebvre, E. (2008). Fast unfolding of communities in large networks. Journal of Statistical Mechanics: Theory and Experiment, 2008(10), P10008. Doi: 10.1088/1742-5468/2008/10/P10008