Download
1 / 117
1.17k likes | 1.35k Views
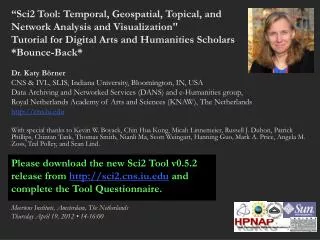
NETWORK AND TOPICAL ANALYSIS FOR THE HUMANITIES USING NWB AND SCI2 Scott Weingart Cyberinfrastructure for Network Science Center Information Visualization Laboratory Indiana Philosophy Ontology Project School of Library and Information Science Department of History and Philosophy of Science

E N D
NETWORK AND TOPICAL ANALYSIS FOR THE HUMANITIES USING NWB AND SCI2 Scott Weingart Cyberinfrastructure for Network Science Center Information Visualization Laboratory Indiana Philosophy Ontology Project School of Library and Information Science Department of History and Philosophy of Science Indiana University, Bloomington, IN http://www.scottbot.net With special thanks to Katy Börner, Kevin W. Boyack, Micah Linnemeier, Russell J. Duhon, Patrick Phillips, Joseph Biberstine, Chintan Tank Nianli Ma, Hanning Guo, Mark A. Price, Angela M. Zoss, and Sean Lind Digital Humanities 2011 Meyer Library 2080E (Language Lab) Stanford University, Stanford, CA 13:00-16:30 on June 19, 2011
1:00-1:15 Introduction to Network Analysis 1:15-1:45 Network Analysis & Visualization in the Humanities • Theory, Applications, and Pitfalls. • Examples In The Wild 1:45-2:15 Collecting, Cleaning & Formatting Data 2:15-2:25 Break 2:25-3:00 Sci2 Tool Basics • Macroscope Design and Usage. • Download and run the tool. • Find basic statistics and run various algorithms over the network. • Visualize the networks as either a graph or a circular hierarchy. 3:00-3:20 Sci2 Workflow Design: Padgett's Florentine Families - Prepare, load, analyze, and visualize family and business networks from 15th century Florence. 3:20-3:35 Break 3:35-4:00 Sci2 Research Demonstration: Mapping the Republic of Letters 4:00-4:30 Q&A and Technical Assistance Workshop Overview 2
What is a network? Source: http://dh2011network.stanford.edu/index.html
What is a network? • Graph • Nodes • Node Types • Vertices • Edges • Edge Types • Arcs • Network vs. Visualization Source: http://dh2011network.stanford.edu/index.html
What is a network? *Nodes id*int label*string totaldegree*int 16 “Merwede van Clootwyck, Matthys van der (1613-1664)” 1 36 “Perrault, Charles” 1 48 “Bonius, Johannes” 1 67 “Surenhusius Gzn., Gulielmus” 1 99 “Anguissola, Giacomo” 1 126 “Johann Moritz, von Nassau-Siegen (1604-1679)” 6 131 “Steenberge, J.B.” 1 133 “Vosberghen Jr., Caspar van” 1 151 “Bogerman, Johannes (1576-1637)” 25 *DirectedEdges source*int target*int weight*float eyear*int syear*int 16 36 1 1640 1650 16 126 5 1641 1649 36 48 2 1630 1633 48 16 4 1637 1644 48 67 10 1645 1648 48 36 2 1632 1638 67 133 7 1644 1648 67 131 3 1642 1643 99 67 9 1640 1645 126 16 3 1641 1646 131 133 5 1630 1638 131 99 1 1637 1639 133 36 4 1645 1648 133 48 8 1632 1636 151 48 6 1644 1647
Graph Metrics – Nodes / Vertices / Entities • Degree Centrality - direct connections • Betweenness Centrality – # of shortest paths a node sits between • Closeness Centrality – Distance to all nodes • Hubs / Bridges / Isolates Source: http://dh2011network.stanford.edu/index.html
Graph Metrics – Nodes / Vertices / Entities • Degree Centrality • Betweenness Centrality • Closeness Centrality • Hubs / Bridges / Isolates
Graph Metrics – Edges / Links / Arcs / Connections / Ties • Shortest paths – shortest distance between two nodes • Weight – strength of tie • Directionality – is the connection one or two-way? • Bridge – deleting would change structure Source: http://dh2011network.stanford.edu/index.html
Graph Metrics – Edges / Links / Arcs / Connections / Ties • Shortest paths • Weight • Directionality • Bridge
Graph Metrics – Structural • Clusters – closely connected or similar nodes & edges • Clustering coefficient – ‘clique-ness’ • Centralization – egocentric or decentralized • Density – ‘spaghetti-ness’ • Average Path Length – wide or narrow Source: http://dh2011network.stanford.edu/index.html
Graph Metrics – Structural • Clusters • Clustering coefficient • Centralization • Density • Average Path Length
Graph Metrics – Types Of Networks • Bi-Modal or Multi-Nodal • Egocentric • Dense/Sparse Source: http://dh2011network.stanford.edu/index.html
Networks – Visualization • Networks visualized as graphs • Layouts • Force-based / Spring / GEM • Tree • Circular • Distance Re-training Source: http://dh2011network.stanford.edu/index.html
1:00-1:15 Introduction to Network Analysis 1:15-1:45 Network Analysis & Visualization in the Humanities • Theory, Applications, and Pitfalls. • Examples In The Wild 1:45-2:15 Collecting, Cleaning & Formatting Data 2:15-2:25 Break 2:25-3:00 Sci2 Tool Basics • Macroscope Design and Usage. • Download and run the tool. • Find basic statistics and run various algorithms over the network. • Visualize the networks as either a graph or a circular hierarchy. 3:00-3:20 Sci2 Workflow Design: Padgett's Florentine Families - Prepare, load, analyze, and visualize family and business networks from 15th century Florence. 3:20-3:35 Break 3:35-4:00 Sci2 Research Demonstration: Mapping the Republic of Letters 4:00-4:30 Q&A and Technical Assistance Workshop Overview 15
Network Analysis & Visualization in the Humanities: Theory, Applications, and Pitfalls 16
Solidifies objects of inquiry Exploration Discovery Trend-spotting Evidence Audience Engagement Engaging public / funding agencies Uses of Visualization
[Visualization] aim at more than making the invisible visible. [It aspires] to all-at-once-ness, the condensation of laborious, step-by-step procedures in to an immediate coup d’oeil… What was a painstaking process of calculation and correlation—for example, in the construction of a table of variables—becomes a flash of intuition. And all-at-once intuition is traditionally the way that angels know, in contrast to the plodding demonstrations of humans. Descartes’s craving for angelic all-at-once-ness emerged forcefully in his mathematics…, compressing the steps of mathematical proof into a single bright flare of insight: “I see the whole thing at once, by intuition.” Lorraine Daston – On Scientific Observation The Importance of Visualization
[H]umanists have adopted many applications such as GIS mapping, graphs, and charts for statistical display that were developed in other disciplines… such graphical tools are a kind of intellectual Trojan horse… Data pass themselves off as mere descriptions of a priori conditions. Rendering observation (the act of creating a statistical, empirical, or subjective account or image) as if it were the same as the phenomena observed collapses the critical distance between the phenomenal world and its interpretation, undoing the basis of interpretation on which humanistic knowledge production is based... we seem ready and eager to suspend critical judgment in a rush to visualization. Johanna Drucker – Humanities Approaches to Graphical Display Warnings
Data format limits use, already an act of interpretation. Statistics is often misused (wield it very carefully). Interpreting spatial distance as meaningful. Always include a legend (this presentation breaks that rule). Accidental legitimization in eyes of public. Warnings
Network Analysis & Visualization in the Humanities: Examples In The Wild 21
Digital Humanities 2011 – Elijah Meeks http://dh2011network.stanford.edu/
Digital Humanities 2011 – Elijah Meeks http://dh2011network.stanford.edu/
Digital Humanities 2011 – Elijah Meeks http://dh2011network.stanford.edu/
Digital Humanities 2011 – Elijah Meeks http://dh2011network.stanford.edu/ • General information • Nodes:621 • Edges:734 • Metrics • Average degree:2.36
Digital Humanities 2011 – Elijah Meeks http://dh2011network.stanford.edu/
Character Networks in the 19th Century British Novel -Graham Sack I use computational methods to count the frequency and co-occurrence of a generally ignored sub-class of common words, namely, character names. Character names are often regarded as noise and excluded from authorship and stylistics analysis because they are not consistent across texts. This study makes character names its main object of analysis because the objective is quite different: rather than style or authorship, this study attempts to make inferences about characterization and social form, two areas about which computational analysis has had comparatively little to say.
Character Networks in the 19th Century British Novel -Graham Sack
Character Networks in the 19th Century British Novel -Graham Sack
Word Co-Occurrences in European Fairytales -Jorgensen & Weingart
Word Co-Occurrences in European Fairytales -Jorgensen & Weingart
Mapping the Republic of Letters – Chang et al.https://republicofletters.stanford.edu/#maps
1:00-1:15 Introduction to Network Analysis 1:15-1:45 Network Analysis & Visualization in the Humanities • Theory, Applications, and Pitfalls. • Examples In The Wild 1:45-2:15 Collecting, Cleaning & Formatting Data 2:15-2:25 Break 2:25-3:00 Sci2 Tool Basics • Macroscope Design and Usage. • Download and run the tool. • Find basic statistics and run various algorithms over the network. • Visualize the networks as either a graph or a circular hierarchy. 3:00-3:20 Sci2 Workflow Design: Padgett's Florentine Families - Prepare, load, analyze, and visualize family and business networks from 15th century Florence. 3:20-3:35 Break 3:35-4:00 Sci2 Research Demonstration: Mapping the Republic of Letters 4:00-4:30 Q&A and Technical Assistance Workshop Overview 33
65% collecting, 25% cleaning, 5% formatting, 5% analysis. Keep analysis in mind before first data collected Remember not just current use but future use as well; nobody wants to do the same work five times. Make sure system for data entry is easy, transferrable, and as granular as possible. Data Collection
Multiple coders? Undergraduates? Check for intercoder reliability. Understand biases going in. Microsoft Excel is your friend (ubiquitous, easy). Consistency in word use and coding. Sanity checks at the extremes – order by size, etc. Check against existing databases if available. Make sure basic statistics make sense. Data Cleaning & Validation
Excel Database Text CSV File-types
Matrix Adjacency List Node & Edge List Network Formats
NWB Format *Nodes id*int label*string totaldegree*int 16 “Merwede van Clootwyck, Matthys van der (1613-1664)” 1 36 “Perrault, Charles” 1 48 “Bonius, Johannes” 1 67 “Surenhusius Gzn., Gulielmus” 1 99 “Anguissola, Giacomo” 1 126 “Johann Moritz, von Nassau-Siegen (1604-1679)” 6 131 “Steenberge, J.B.” 1 133 “Vosberghen Jr., Caspar van” 1 151 “Bogerman, Johannes (1576-1637)” 25 *DirectedEdges source*int target*int weight*float eyear*int syear*int 16 36 1 1640 1650 16 126 5 1641 1649 36 48 2 1630 1633 48 16 4 1637 1644 48 67 10 1645 1648 48 36 2 1632 1638 67 133 7 1644 1648 67 131 3 1642 1643 99 67 9 1640 1645 126 16 3 1641 1646 131 133 5 1630 1638 131 99 1 1637 1639 133 36 4 1645 1648 133 48 8 1632 1636 151 48 6 1644 1647
1:00-1:15 Introduction to Network Analysis 1:15-1:45 Network Analysis & Visualization in the Humanities • Theory, Applications, and Pitfalls. • Examples In The Wild 1:45-2:15 Collecting, Cleaning & Formatting Data 2:15-2:25 Break 2:25-3:00 Sci2 Tool Basics • Macroscope Design and Usage. • Download and run the tool. • Find basic statistics and run various algorithms over the network. • Visualize the networks as either a graph or a circular hierarchy. 3:00-3:20 Sci2 Workflow Design: Padgett's Florentine Families - Prepare, load, analyze, and visualize family and business networks from 15th century Florence. 3:20-3:35 Break 3:35-4:00 Sci2 Research Demonstration: Mapping the Republic of Letters 4:00-4:30 Q&A and Technical Assistance Workshop Overview 40
1:00-1:15 Introduction to Network Analysis 1:15-1:45 Network Analysis & Visualization in the Humanities • Theory, Applications, and Pitfalls. • Examples In The Wild 1:45-2:15 Collecting, Cleaning & Formatting Data 2:15-2:25 Break 2:25-3:00 Sci2 Tool Basics • Macroscope Design and Usage. • Download and run the tool. • Find basic statistics and run various algorithms over the network. • Visualize the networks as either a graph or a circular hierarchy. 3:00-3:20 Sci2 Workflow Design: Padgett's Florentine Families - Prepare, load, analyze, and visualize family and business networks from 15th century Florence. 3:20-3:35 Break 3:35-4:00 Sci2 Research Demonstration: Mapping the Republic of Letters 4:00-4:30 Q&A and Technical Assistance Workshop Overview 41
Just as the microscope empowered our naked eyes to see cells, microbes, and viruses thereby advancing the progress of biology and medicine or the telescope opened our minds to the immensity of the cosmos and has prepared mankind for the conquest of space, macroscopes promise to help us cope with another infinite: the infinitely complex. Macroscopes give us a ‘vision of the whole’ and help us ‘synthesize’. They let us detect patterns, trends, outliers, and access details in the landscape of science. Instead of making things larger or smaller, macroscopes let us observe what is at once too great, too slow, or too complex for our eyes. Microscopes, Telescopes, and Macrocopes
Core Architecture & Plugins/Division of Labor: Computer scientists need to design the standardized, modular, easy to maintain and extend “core architecture”. Dataset and algorithm plugins, i.e., the “filling”, are provided by those that care and know most about the data and developed the algorithms: the domain experts. Ease of Use: As most plugin contributions and usage will come from non-computer scientists it must be possible to contribute, share, and use new plugins without writing one line of code. Users need guidance for constructing effective workflows from 100+ continuously changing plugins. Modularity: The design of software modules with well defined functionality that can be flexibly combined helps reduce costs, makes it possible to have many contribute, and increases flexibility in tool development, augmentation, and customization. Standardization: Adoption of (industry) standards speeds up development as existing code can be leveraged. It helps pool resources, supports interoperability, but also eases the migration from research code to production code and hence the transfer of research results into industry applications and products. Open Data and Open Code: Lets anybody check, improve, or repurpose code and eases the replication of scientific studies. Macroscopes are similar to Flickr and YouTube and but instead of sharing images or videos, you freely share datasets and algorithms with scholars around the globe. Börner, Katy (in press) Plug-and-Play Macroscopes. Communications of the ACM. Desirable Features of Macroscopes
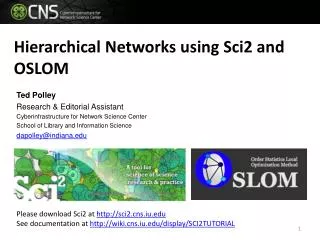
Custom Tools for Different Scientific Communities Information Visualization Cyberinfrastructure http://iv.slis.indiana.edu Network Workbench Tool + Community Wiki http://nwb.slis.indiana.edu Science of Science (Sci2) Tool and Portal http://sci.slis.indiana.edu Epidemics Cyberinfrastructure http://epic.slis.indiana.edu/ 180+ Algorithm Plugins and Branded GUIs + Core Architecture Open Services Gateway Initiative (OSGi) Framework. http://orgi.org Cyberinfrastructure Shell (CIShell) http://cishell.org Macroscope Design 45
CIShell Powered Tools: Network Workbench (NWB) 46
Network Workbench Toolhttp://nwb.slis.indiana.edu The Network Workbench (NWB) tool supports researchers, educators, and practitioners interested in the study of biomedical, social and behavioral science, physics, and other networks. In February 2009, the tool provides more 169 plugins that support the preprocessing, analysis, modeling, and visualization of networks. More than 50 of these plugins can be applied or were specifically designed for S&T studies. It has been downloaded more than 65,000 times since December 2006. Börner, Katy, Huang, Weixia (Bonnie), Linnemeier, Micah, Duhon, Russell Jackson, Phillips, Patrick, Ma, Nianli, Zoss, Angela, Guo, Hanning & Price, Mark. (2010). Rete-Netzwerk-Red: Analyzing and Visualizing Scholarly Networks Using the Network Workbench Tool. Scientometrics. Vol. 83(3), 863-876.
Project Details Investigators: Katy Börner, Albert-Laszlo Barabasi, Santiago Schnell, Alessandro Vespignani & Stanley Wasserman, Eric Wernert Software Team: Lead: Micah Linnemeier Members: Patrick Phillips, Russell Duhon, Tim Kelley & Ann McCranie Previous Developers: Weixia (Bonnie) Huang, Bruce Herr, Heng Zhang, Duygu Balcan, Bryan Hook, Ben Markines, Santo Fortunato, Felix Terkhorn, Ramya Sabbineni, Vivek S. Thakre & Cesar Hidalgo Goal: Develop a large-scale network analysis, modeling and visualization toolkit for physics, biomedical, and social science research. Amount: $1,120,926, NSF IIS-0513650 award Duration: Sept. 2005 - Aug. 2009 Website: http://nwb.slis.indiana.edu
Project Details (cont.) NWB Advisory Board: James Hendler (Semantic Web) http://www.cs.umd.edu/~hendler/ Jason Leigh (CI) http://www.evl.uic.edu/spiff/ Neo Martinez (Biology) http://online.sfsu.edu/~webhead/ Michael Macy, Cornell University (Sociology) http://www.soc.cornell.edu/faculty/macy.shtml Ulrik Brandes (Graph Theory) http://www.inf.uni-konstanz.de/~brandes/ Mark Gerstein, Yale University (Bioinformatics) http://bioinfo.mbb.yale.edu/ Stephen North (AT&T) http://public.research.att.com/viewPage.cfm?PageID=81 Tom Snijders, University of Groningen http://stat.gamma.rug.nl/snijders/ Noshir Contractor, Northwestern University http://www.spcomm.uiuc.edu/nosh/
Computational Proteomics What relationships exist between protein targets of all drugs and all disease-gene products in the human protein–protein interaction network? Yildriim, Muhammed A., Kwan-II Goh, Michael E. Cusick, Albert-László Barabási, and Marc Vidal. (2007). Drug-target Network. Nature Biotechnology 25 no. 10: 1119-1126. 50