2-Sample T-Tests
2-Sample T-Tests. Independent t-test Dependent t-test Picking the correct test. Overview. z-tests with distributions; z-tests with sample means t-tests with sample means New Stuff t-tests with two independent samples e.g., Boys vs. Girls on reading ability test “Independent t-test”

2-Sample T-Tests
E N D
Presentation Transcript
2-Sample T-Tests Independent t-test Dependent t-test Picking the correct test
Overview • z-tests with distributions; z-tests with sample means • t-tests with sample means • New Stuff • t-tests with two independent samples • e.g., Boys vs. Girls on reading ability test • “Independent t-test” • t-tests with two dependent samples • e.g., Hipness level Before and After “Queer Eye for a Straight Guy” • “Dependent t-test” • Later on: ANOVAs – 3+ samples Unit 2: z, t, hyp, 2t
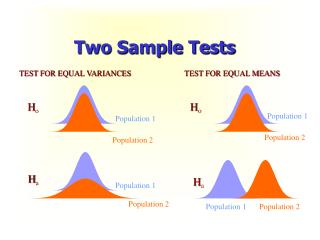
Ind. t-test: 2 sample means • Compares two sample means: • Both σ & μ unknown – only sample info • Compare average aggression level of 20 kids that play violent computer games to 20 kids that don’t. • Study impact of peer pressure on eating disorders. Compare average weight of sorority women vs. non-sorority women. Unit 2: z, t, hyp, 2t
Ind. t-test: Ho • What do we expect if there’s no treatment effect? What would Ho be? • If video games don’t affect aggression…. • μv. games = μno games • μv. games - μno games = 0 [Expect diff. bet means to equal zero] • With sorority study • μv. sorority = μnon-sorority • μv. sorority - μnon-sorority = 0 • So, we define the Ho as μ1 – μ2 = 0 • Sampling distribution centered on this • some observed differences bigger • some observed differences smaller Unit 2: z, t, hyp, 2t
Indep t-test: formula Actual difference observed. (For our purposes, always zero) • Standard Error of the Difference (between the means) • difference expected between sample means • how much we expect the sample means to differ purely by chance Unit 2: z, t, hyp, 2t
Sampling Distribution of the Difference Between Means Unit 2: z, t, hyp, 2t
Ind. t-test: Example Unit 2: z, t, hyp, 2t
Ind. t-test: Example Unit 2: z, t, hyp, 2t
Hypothesis Testing Steps (Ind. t) 1. Comparing xbar1and xbar2, μ and σ unknown. 2. H0: μ1 – μ2 = 0; HA: μ1 – μ2 ≠ 0 • α = .05, df = n1+n2–2 = 5 + 5 - 2 = 8 tcritical = 2.306 4. tobtained = -1.947 5. RETAIN the H0 . • The research hypothesis was not supported. The weight of women in sororities (M=111) does not differ significantly from that of other women (M=127), t(8)= -1.947, n.s.. (not needed if using SPSS) Unit 2: z, t, hyp, 2t
Effect Size (Ind. t) • Since we retained the Ho, we don’t need an effect size statistics. However, if we did, it would work like this… • first calculate ŝ (standard deviation of all the scores combined)… • then d… number in one group Unit 2: z, t, hyp, 2t
Dependent T-test • 2 samples • two groups are matched in some way (e.g., pairs of twins are divided between two groups) • typically the same people are in both groups (e.g., before & after design) • Example: The North American Bacon Council tests if participants change weight after 6 months of an all bacon diet. • IV: Diet (normal, all-bacon); DV: Weight • Standard Error of the Mean Difference Unit 2: z, t, hyp, 2t
Hypothesis Testing Steps (Dep. t) 1. Comparing xbar1and xbar2, μ and σ unknown. 2. H0: μD = 0 HA: μD ≠ 0 3. α = .05, df=npairs –1 = 7-1 = 6, tcritical = 2.447 • tobtained = -3.074 5. REJECT the H0 • The research hypothesis was supported. The weight of subjects before the all bacon diet (M=188.57) was significantly less than the weight after (M=203.57), t(6)= -3.074, p≤ .05. The effect of the diet on weight was large, d=1.1619. Get off SPSS print-out Unit 2: z, t, hyp, 2t