Selecting Among 2-Sample Tests
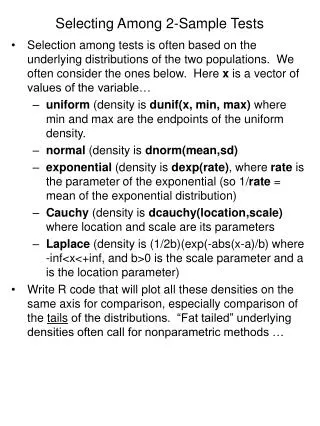
Selecting Among 2-Sample Tests. Selection among tests is often based on the underlying distributions of the two populations. We often consider the ones below. Here x is a vector of values of the variable…

Selecting Among 2-Sample Tests
E N D
Presentation Transcript
Selecting Among 2-Sample Tests • Selection among tests is often based on the underlying distributions of the two populations. We often consider the ones below. Here x is a vector of values of the variable… • uniform (density is dunif(x, min, max) where min and max are the endpoints of the uniform density. • normal (density is dnorm(mean,sd) • exponential (density is dexp(rate), where rate is the parameter of the exponential (so 1/rate = mean of the exponential distribution) • Cauchy (density is dcauchy(location,scale) where location and scale are its parameters • Laplace (density is (1/2b)(exp(-abs(x-a)/b) where -inf<x<+inf, and b>0 is the scale parameter and a is the location parameter) • Write R code that will plot all these densities on the same axis for comparison, especially comparison of the tails of the distributions. “Fat tailed” underlying densities often call for nonparametric methods …
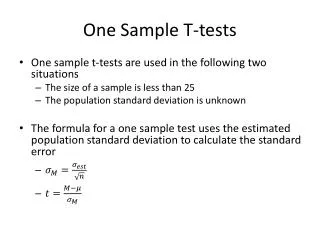
Assume Xi from treatment 1 and Yj from treatment 2 and that they have cdf's given by: Also assume the cdf's are continuous (no ties). The hypothesis tested is • If the cdfs are normal with unknown but equal variances, then the t-test is the best. Departure from normality has little effect on Type I error, because of the Central Limit Theorem, but there are problems with power if they are non-normal. • See Table 2.9.1 for a comparison of the Wilcoxon rank-sum test versus the t-test. Note that for small samples and "light-talied" distributions (those without much chance of outliers), the t-test is probably better. Otherwise, use Wilcoxon • Another way of comparing these two tests is via relative efficiency (and ARE, asymptotic relative efficiency). See the definition on p. 62: basically, test 1 is more efficient than test 2 if it requires a smaller sample size to achieve the same power.
The ARE of the Wilcoxon test versus the t-test is >= .864 but can be arbitrarily large (see Table 2.9.2). Even for normal cdfs, the ARE of Wilcoxon vs. t-test is .955 • The permutation test vs. the Wilcoxon test and the t-test is discussed in 2.9.4. There are a couple things to note here: • little is gained by doing more than 1600 randomly sampled permutations • see Table 2.9.3 for comparison with t-test • see Table 2.9.4 for comparison with Wilcoxon test