t-Tests
t-Tests. Overview of t-Tests. How a t-Test Works Single-Sample t Independent Samples t Paired t Effect Size. How a t-Test Works. The t-test is used to compare means. The difference between means is divided by a standard error. The t statistic is conceptually similar to a z-score. .


t-Tests
E N D
Presentation Transcript
Overview of t-Tests • How a t-Test Works • Single-Sample t • Independent Samples t • Paired t • Effect Size
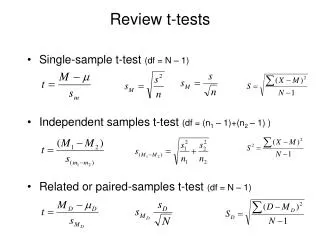
How a t-Test Works • The t-test is used to compare means. • The difference between means is divided by a standard error. • The t statistic is conceptually similar to a z-score.
The t-Test as Regression • bo is the mean of one group • b1 is the difference between means • If b1 is significant, then there is a significant difference between means
Single Sample t-test • Compare a sample mean to a hypothesized population mean (test value based on previous research or norms)
Assumptions for Single-Sample t 1. Independent observations 2. Normal distribution or large N 3. Interval or ratio level data
Sampling Distribution of the Mean • The t distribution is symmetrical but flatter than a normal distribution. • The exact shape depends on degrees of freedom.
normal distribution t distribution
Degrees of Freedom • Amount of information in the sample • Changes depending on the design and statistic • For a one-group design, df = N-1 • The last score is not “free to vary”
Independent Samples t-test • Also called: Unpaired t-test • Use with between-subjects, unmatched designs
Sampling Distribution of the Difference Between Means • We are collecting two sample means and finding out how big the difference is between them. • The mean of this sampling distribution is the Ho difference between population means, which is zero.
sampling distribution of the difference between means m1- m2 x1-x2
Independent Samples t -test Assumptions • Interval/ratio data • Normal distribution or N at least 30 • Independent observations • Homogeneity of variance - equal variances in the population
Levene’s Test • Test for homogeneity of variance • If the test is significant, the variances of the two populations should not be assumed to be equal
Independent Samples t-testInterpretation • Sign of t depends on the order of entry of the two groups • df = N1 + N2 - 2 • Use Bonferroni correction for multiple tests • Divide alpha level by the number of tests
Paired t-Test • Also called: Dependent Samples or Related Samples t-test • Compares two conditions with paired scores: • Within subjects design • Matched groups design
Paired Samples t-Test Assumptions • Interval/ratio data • Normal distribution or N at least 30 • Independent observations
Paired Samples t-test - Interpretation • The sign of the t depends on the order in which the variables are entered • df = N-1 • Use Bonferroni correction for multiple tests
Effect Size • Statistical significance is about the Null Hypothesis, not about the size of the difference. • A small difference may be significant with sufficient power. • A significant but small difference may not be important in practice.
Effect Size with r2 • Compute the correlation between the independent and dependent variables. • This will be a point-biserialcorrelation. • Square the r to get the proportion of variance explained.
Example APA Format Sentence • A paired samples t-test indicated a significant difference between the number of incorrect items (M = 2.64, SD = 2.54) and the number of lures recalled (M = 3.30, SD = 1.83), t(97) = 2.54, p = .013, r2 = .06.
Choosing Stats Participants are asked to rank a set of 20 photos of women on attractiveness of the women and then to rank the same photos again on friendliness of the women. The researcher hypothesizes that attractiveness will be positively correlated with perceived friendliness.