Download
1 / 26
260 likes | 422 Views
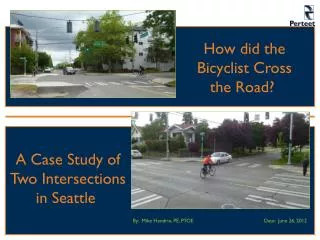
How did the Bicyclist Cross the Road?. A Case Study of Two Intersections in Seattle. By: Mike Hendrix, PE, PTOE Date: June 26, 2012. Seattle Bike Master Plan. A blueprint for making improvements to Seattle’s bicycle network Adopted in 2007 Seattle BMP Goals: Triple bicycling by 2017

E N D
How did the Bicyclist Cross the Road? A Case Study of Two Intersections in Seattle By: Mike Hendrix, PE, PTOE Date: June 26, 2012
Seattle Bike Master Plan • A blueprint for making improvements to Seattle’s bicycle network • Adopted in 2007 • Seattle BMP Goals: • Triple bicycling by 2017 • Reduce bicycle collisions by 1/3 between 2007 and 2017
Seattle Bike Master Plan • Seattle BMP Accomplishments: • Installed 129 miles of on-street facilities including bike lanes and sharrows • Added over 9 new miles of multi-use trail improvements • Implemented 98 miles of signed bicycle routes • Installed over 2,200 bicycle parking spaces
Case Study What? • Analysis of 2 intersections before and after signal installation • Both intersections were along a neighborhood greenway • Signals weren’t warranted based on MUTCD criteria Why? • To determine if the traffic signals installed along this neighborhood greenway improved conditions – for ALL users
Case Study • Determined changes in volumes • Determined changes in collisions • Observed operational issues
Background • Unwarranted signals are BAD. • They: • Increase collisions • Increase red-light running • Increase delay • Increase noise and air pollution • Lead to increased maintenance costs • Lead to a potential increase in cut-through traffic
Background • 2011 Pinellas County Study: • 273% annual increase in collisions • 2008 Kentucky Study: • 28.3% increase in collisions • 221.7% increase in rear-end collisions • 1989 New York City Study: • 65% increase in collisions • 1979 Purdue University Study • 3,200 to 4,200 vehicle hours of delay
Site 1Fremont Ave N & N 80th St • Fremont Ave N – 25’ wide residential street • N 80th St – 1 lane each direction with on-street parking on north side • 15,500 vpd (N 80th St) • 700 vpd (Fremont Ave N) • Signal turn-on 11/16/2007
Site 2Fremont Ave N & N 105th St • Fremont Ave N – 25’ wide residential street • N 105th St – 2 lanes each direction with no on-street parking • 23,000 vpd (N 105th St) • 900 vpd (Fremont Ave N) • Signal Turn on 10/7/2010
Signing and Markings Span Wire Sign Pavement Marking
Operational Issue: Violations • Fremont Ave N & N 80th St • NB: 12.8% (23 cars) • SB: 14.1% (22 cars) • Fremont Ave N & N 105th St • NB: 13.5% (38 cars) • SB: 12.9% (30 cars)
Operational Issue: Hot Spot Marking • Fremont Ave N & N 105th St • 27 of 232 (11.6%) bicyclists went directly for pedestrian push button. • Fremont Ave N & N 80th St • Roughly same proportion
Summary • Neither signal met 2009 MUTCD signal warrants. Both met PHB warrants in the after condition. • Collisions and collision rates decreased at both signals following signal installation. • Severity of collisions at both signals decreased following the signal installation.
Summary • Bike and pedestrian volumes increased while motor vehicle volumes remained relatively constant. • Significant portion of motorists observed violating turning restrictions. • Observed significant misunderstanding of “Hot Spot” markings by bicyclists.
Thank you for your time! • Questions? • Contact Information • Mike Hendrix, PE, PTOE • mhendrix@perteet.com • 206-436-0515