Download

1 / 18
180 likes | 287 Views
Explore the implications of world population reaching 9.2 billion by 2050. Cover population trends, demographic transition, top countries, and future projections. Dive into the phases of the Demographic Transition Model and the impact of migration and urbanization.

E N D
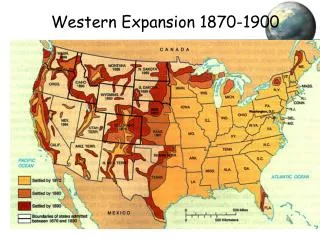
According to the UN, world population is expected to grow to 9.2 billion by the year 2050. What challenges do you see if this prediction proves accurate? Chapter 1-3 “Population & Settlement: People on the Land”
After Today… • Students should be able to predict future population trends. • Students will discuss consequences / challenges based upon future population trends. • Students will fully comprehend the 4 phases of the Demographic Transition Model.
Basic World Pop. Stats… • World Population Clock • 2013 Pop. Map with 2050 projections • World Population Milestones • Note the time it took to add each additional billion after the first in 1827!
Basic Population terms/concepts • RNI = Rate of Natural increase. It is found by taking the number of births and subtracting the number of deaths (does not account for migration into or out of a country). • TFR = Total Fertility Rate. This is a measure of the average # of children a woman will have in her child bearing years. • Youthfulness of a population is a measure of the % of the total population that is <15 yrs. Of age…it is vital to maintaining productive stability in a nation.
Top 10 Countries (Source USA Census Bureau) • China 1.3 Billion • India 1.2 B • USA 313 Million • Indonesia 246 M • Brazil 203 M • Pakistan 187 M • Bangladesh 159 M • Nigeria 155 M • Russia 139 M • Japan 126 M
Future??? (2050 according to Population Reference Bureau) • India 1.7 Billion • China 1.3 B • USA 403 Million • Nigeria 390 M • Indonesia 293 M • Pakistan 275 M • Brazil 223 M • Bangladesh 194 M • Philippines 155 M • Democratic Republic of the Congo 149 M
Demographic Transition Model • Phase #1 – Pre Industrial • High Birth Rates • High Death Rates • Slow Rate of Natural Increase (RNI) • Usually associated with poor public health measures like lack of sanitation. • AKA – Less Developed Countries, 3rd World Countries
Angola source CIA Factbook • Median Age – 18.1 • Life expectancy at birth – 38.76 • Total fertility Rate – 5.97 children / woman
Demographic Transition Model • Phase #2 – Transitional • High Birth Rates • Death Rates Fall (Higher Life expectancies) • Rapid Rise in the RNI • Associated with improved economic and social conditions
India • Median Age – 26.5 years • Life expectancy at birth – 67.14 years • Total Fertility Rate – 2.58 children per woman
Demographic Transition Model • Phase #3 – Transitional • Birth Rates Begin to Fall rapidly • Death Rates Fall slightly • RNI begins to level off • In an urbanized and industrial society people begin to see the benefits of smaller families.
Demographic Transition Model • Phase #4 – Industrial • Low Birth Rates • Low Death Rates • RNI is relatively flat or even in slight decline • Usually associated with highly industrialized and highly urbanized countries.
Japan • Median Age – 44.8 • Life expectancy at birth – 82.25 • Total fertility Rate – 1.21 children / woman
Migration – movement into or out of a country – also affects population • PUSH FORCES: drive people from their homelands. • EXAMPLES: civil war or unrest; environmental disasters; unemployment; ? • PULL FORCES: things that attract migrant populations to certain locations. • EXAMPLES: better economic opportunity; better health services; better educational opportunities; personal & political freedom; ?
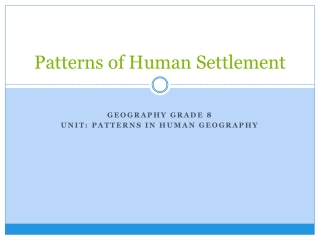
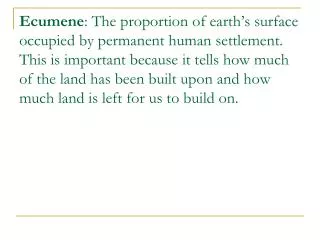
Urbanization • Migration of people from rural areas to urban areas. • Growth of cities. • URBANIZED POPULATION = % of an area’s total population that lives in cities. • Currently about 50% of the world’s population lives in urban areas. • This number is increasingat a rapid rate throughout the entire world • URBAN PRIMACY – a city that is disproportionately large & dominates economic, political & cultural activities.
Overurbanization • When the urban population grows more quickly than support services such as housing, transportation, waste disposal and water supply • Fairly common in 3rd World Countries
Squatter Settlements • Illegal developments of makeshift housing on land neither owned nor rented by the inhabitants. • Fairly common in many LDC’s or 3rd World Countries