Download
1 / 42
420 likes | 437 Views
A comprehensive disaster scenario simulator integrating warning transmission, evacuation, and tsunami simulations for estimating casualties. Visualization in GIS framework aids decision-making to evacuate. Explore tsunami hazard and disaster information.

E N D
Tsunami Scenario Simulator Toshitaka Katada Gunma University, Japan Noriyuki Kuwasawa Gunma University, Japan Harry Yeh Oregon State University
Tsunami Scenario Simulator • Integration of • Warning Transmission Simulation • Evacuation Simulation • Tsunami Simulation • Estimation of the casualties • Visualization in the GIS Framework
The Comprehensive Disaster Scenario Simulator Disaster Mitigation Strategy Disaster Scenario Simulator Tsunami Hazard Disaster Information Decision making to evacuate Evacuation Processes Assessment (Evacuation/Casualty Estimate) Strategy for Tsunami Disaster Preparedness
Tsunami Simulation • This simulation is made separately from the other simulations for warning transmission and evacuation. • The simulator uses the pre-prepared results of various scenarios. • Ex.: Quake Scale, Arrangement of embankment
Evacuation Simulation The present simulation is very simple. • Evacuee Unit • Family. Evacuation starts from a house. • Speed • A fixed speed from a start to arrival • Shelter locations • Pre-set the locations. • Route • An evacuee takes the shortest route following the road network.
Expression of Oral Communication Network The base network is composed of oral communication network. The media will be added to this base network. y x y ◎ ( , ) ◎ 1 1 ◎ ◎ ◎ ◎ ◎ x y ( , ) ◎ 2 2 x y ( , ) n n x y ( , ) 3 3 x 0 Human Community Network
Expression and Control of Oral Communication The generation of oral communication network is controlled by the four parameters. The Control Parameters of Oral Communication Network Number of Contacts(Receivers) Distance of Each Contact Timing of Each Contact Communication Parameters
○ ○ X X ○ P ○ Z Z P 2 1 ○ ○ Y Y ReflectionLinkage Mutual Linkage P =σ+(1-σ)d P =π+(1-π)d 2 1 Communication Parameters Random Choice Network Parameter Controlled Network ◎ ○ ◎ ◎ ◎ ◎ ◎ ◎ ◎ ◎ ◎ ◎ ◎ ○ b b ◎ ◎ ◎ ○ a a ◎ ○ ◎ ○ Spread of network is restricted. π: Reflection Bias Parameter σ: Mutual Bias Parameter
The Differences in The Control Parameters between Normal Days and During Disaster By using these control parameters, this simulation expresses the transmission condition at the normal days and during disaster. Normal Days During Disaster The Number of Contacts (Receivers) small large The Distance to Each Receiver long short The Timing of Each Contact - - Communication Parameters large small The control parameters were determined by questionnaire survey.
Media (in case of Fixed Loudspeakers) The Loudspeaker is combined into oral communication network. The Parameters for Loudspeaker #1 Location , #2 Audible Distance, #3 Audience Rating, #4 Announcement Frequency and Each Timings
Description of Transmission Media and Its Functions The functions of each media is described by using following parameters in the simulation. Media Parameter The Distribution of Number of Contacts, Walking-speed, The Distribution of Distance to Receiver, Commu. Para. Oral Communication The Distribution of Number of Contacts, Connecting Ratio Telephone The Route and Speed, Departure Time, Audible Distance, Audience Rating Patrol car, Fire Engine (With Loudspeaker) Audible Distance, Audience Rating, Announcement Frequency and Timings Fixed Loudspeaker TV, Radio Audience Rating, Announcement Frequency and Each Timings
Evaluation of the Simulation Result Evaluation Factors <<Personal Level ⇒ Regional Level>> #1 Info-Receive Count ⇒Ratio of Info-Receiver #2 Info-Receive Time ⇒Timing Distribution of Info-Receiving #3 Step Count by Human communication ⇒ Ratio of Correct Info. 0 1 ? 10 10 15 15 2 ? 3 8 8 ? 12 12 50 % 45 min 45 = 12 + 8 + 15 + 10 #3 Step Count by Human communication #1: #2 Info-Receive Count Info-Receive Time ▼ ▼ ▼ Ratio of Correct Info. Ratio of Info-Receiver Timing Distribution of Info-Receiving
The Process of Correct Information Transmission • Human Communication(Oral,Telephone) is apt to change contents of the information. ex. Evacuate to the Building! ⇔ Evacuate from the Building! If information change in probability of 30%,…. 1st Step 2nd Step 3rd Step 100% 70% 49% 34% Correct Information
Integration of simulation • The simulator integrates the results of each simulation by using GIS. • Evacuation start time is calculated by information receive time. • Estimate casualties from the spatial relation between a distribution of evacuee and inundation area of tsunami. GIS Disaster Info. Simulation Refuge start time is calculated by information receive time Evacuation Simulation Estimate human damage from the spatial relation Tsunami Simulation
M I E Owase City • Tsunami-prone area • (1944 Tounankai-oki, 1946 Nankaido-oki, 1960 Chilean) • The big tsunami is expected by a Nankai-Tonankai earthquake that will probably occur in the near future.
Tsunami Scenario Owase City
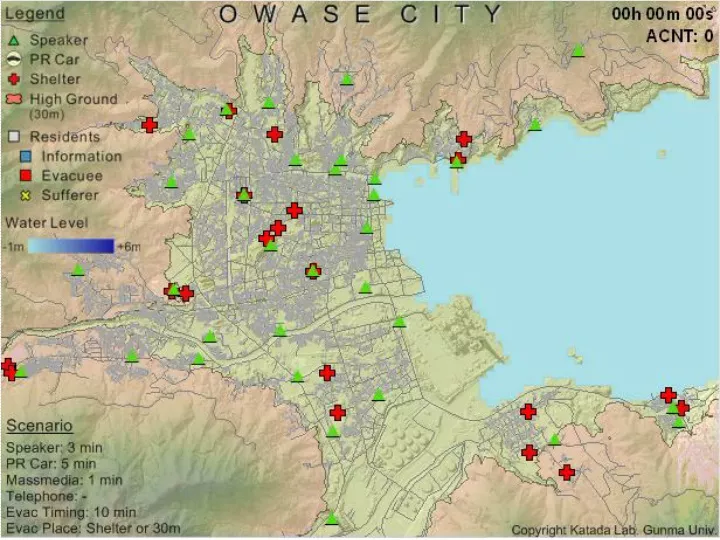
Setting of Basic Condition • Input the information facilities and evacuation facilities Households: 6,651 Loudspeakers: 35 Patrol Cars: 4 Shelters: 25 Loudspeaker Refuge Place Patrol CarRoute Road Network High Ground (30m)
Inundation Area Water Level 予想津波浸水域 0 1 Km
Result of the Information Simulation Info-Receive Time TENMANURA 0.0 ~ 3.5 3.5 ~ 4.0 4.0 ~ 4.5 4.5 ~ 5.0 5.0 ~ 5.5 5.5 ~ 6.0 6.0 ~ 6.5 6.5 ~ 7.0 7.5 ~ (min) SAKAE-CHO MUKAI Ratio of Info-Receiver:98.52% Ave. of Info-Receive Time: 4min 58sec ※Loudspeaker and Patrol Car 3min ※Mass media (Audience Rating 30%) 3min
Result of Evacuation Simulation Arrival Time 5min 6min 7min 8min 9min 10min 11min 12min > 12min High Ground Average of Arrival Time: 8min 27sec Scenario: Residents start to evacuate immediately after information received.
Scenario Analysis • Disaster Information Scenario • If the transmission of disaster information is delayed… • Loudspeaker, Patrol Car Start Timing1 min, 2 min, 3 min,..…20 min, 30 min, 60 min • Mass media broadcast timing is fixed. (3 min) • Evacuation Scenario • If the evacuation is delayed… • Evacuation Start Timing0 min ~ 10min
Simulated Number of Causalities The Number of Causalities:
The Scenario Simulator can be used for: • Disaster Preparedness • Evaluate the Existing Disaster Preparedness: Strategy and Conditions • Develop or Improve the Mitigation Strategy • Educational Tool • Dynamic Hazard Map
Dynamic Hazard Map • Simulation Scenario Pattern
Problem of previous simulation model • At the event of disaster, all the people are assumed to be in their house just like the condition at midnight. • Evacuees’ behaviors are determined as the family units: no individual response is considered in the model. • In the previous system, each simulation model was run independently. Therefore, there is no interaction or feedback among the three simulation runs: info transmission, evacuation, and tsunami-runup models. • For example, the previous model cannot simulate: • No information transmission during the evacuation. We need (Evacuation <-> Info. transmission) • Evacuation route is independent from tsunami situation. We need (Evacuation <-> Tsunami)
Changes in the simulation concept • Old Simulation: Stopwatch Model • The previous simulation can be called a “stopwatch” model because the simulation commenced at the event of earthquake. • This model doesn't consider the timing of the earthquake. • New Simulation: Clock Model • The new simulation model can handle the situation which the disaster occurs at arbitrary time. • How much the damage will be if the earthquake strikes at 9 am and the tsunami attack at 9:20 am? • Advantages of Clock Model • This model can keep track the behavior of each individual. • This model can estimate the damage that changes by the occurrence time of the disaster. • This model can include the interactions of all the simulations (evacuation, warning-transmission, and tsunami-runup).
Outline of Clock Model • Expression ContentThis model expresses the change in the distribution of population during a day. • Population • Population at daytime and nighttime*Population inflow and outflow • Traffic • go to work, go to school, sightseeing, shopping, etc. • Modeling Policy • This model may not be able to describe accurately human activities in detail. But, the gross pattern of the community can be adequately represented. • Because we apply Monte-Carlo simulations, population distribution changes slightly at every simulation. However, the statistics of the community activities remain the same. • We designed the model so that it requires information that is readily available, for example census data.
Sample Case 1 • If the earthquake occurs at midnight • Earthquake 1:00 AM • Mass media 1:03、1:13 Audience Rating 30% • Loudspeaker 1:05、1:10 • P.R. Car 1:07 • Refuge timing 5 min. after info. received • Refuge Ratio Quake 0.1% Info. 100%
Time Scenario Setting • Scenario is set by a timeline control panel Time scale Student go to school time PR Car departure time Mass Media broadcast time Standard deviation Mean Speaker broadcast time Worker commute time
Sample Case 2 • If the earthquake occurs at commuting time • Earthquake 8:30 AM • Mass media 8:33、8:43 Audience Rating 40% • Loudspeaker 8:35、8:40 • P.R. Car 8:40 • Refuge timing Immediately after info. Received • Refuge Ratio Quake 0.1% Info. 100%
Population Distribution • Expression of population • Census • Total population, gender, age. • Total number of households and the types: one person, the couple, the couple with a child or children, etc. • Change in population distribution during a day: the inflow & outflow rates of worker, student, and tourists. • Expression of Residential and Commercial buildings • Identify and classify residential and commercial buildings from the digital housing map • The number of employees is estimated from the floor area.
Expression of Traffic • Traffic • Individual’s working place is assigned randomly from space designated as commercial buildings. Each individual is assumed to commute by car. • Individual’s school is determined based on the residence and the school district. (commute on foot) • Considering the road width and speed limit, the shortest route is used for the individual’s commute. • TimingTiming of the individual’s commute is set stochastically: in the simulation, the timing is expressed by the averaged starting time for commute with its standard deviation. The required input parameters are: • Attendance at work time、Working time • Attendance at school time, Go home time, etc.
Transition of population distribution by Clock Model 8:00 AM The morning traffic increases. Congestion occurs in part. 1:00 AM A lot of people are in the house. Central Business District Bypass 0:00 PM The traffic decreases. The population concentrates in central business district. 6:00 PM The evening traffic increases. Traffic is lighter compared with the morning.
Variations in damage due to the time of tsunami attack If the resident doesn't evacuate at all. When occurrence time changes… In a current simulation… At the commuting time The earthquake occurs at 9 o’clock 9:30AM Casualties:3925 At the daytime The earthquake occurs at 12 o’clock 0:30PM When it is at midnight The earthquake occurs at 0 o’clock 0:30AM Casualties:2830 Casualties:4023 At time of coming home The earthquake occurs at 18 o’clock 6:30PM Casualty The number of casualties greatly influenced by the occurrence time of tsunami Casualties:3167