Download
1 / 16
160 likes | 193 Views
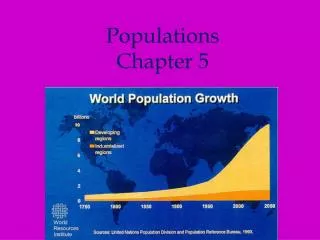
This chapter discusses the concepts of population size, density, and dispersion, as well as the importance of age structure and survivorship curves in understanding population dynamics. It also explores the difficulties in measuring and estimating population sizes, particularly for migratory birds.

E N D
Objectives • Explain the difference between population size, density, and dispersion • Describe the three main patterns of population dispersion • Explain the importance of a populations age structure • Contrast the three main types of survivorship curves
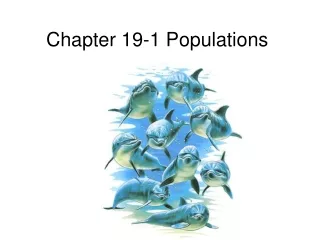
Populations • Defined by place & time • Size: number of individuals • How do you find size? Count everyone? • U.S. census • Estimation: take a small sample and extrapolate to a larger area • Density: How crowded? • Individuals per unit volume
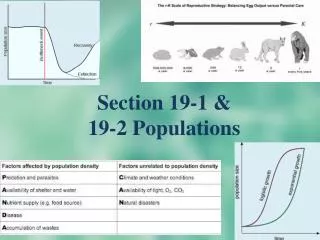
Country Population Area (km²) Density— World 6,445,398,968 148,940,000 43 Singapore 4,425,720 692.76 389 United States 295,734,134 9,631,418 30 Australia 20,090,437 7,686,850 2
Population dynamics • Birth rate: number of births over a period of time • Also fertility rate: How many offspring each female has • Developed ~ 1/2 • Developing ~ 5/6 • Death/mortality rate: number of births over a period of time • Life expectancy: how long an individual is expected to live • Girls live longer
Shows distribution of individuals among different groups. Explain how it is possible to conclude that the life expectancy of a person in a stable population is longer than that of a person in an expanding population. How can you tell that women have a longer life expectancy than men? Age structure
Predictions from survivorship curve • Which countries population has the potential for rapid growth? • Bottom heavy curves indicate that many young have been added to the youngest & most reproductive age group.
Survivorship curves • Show how many individuals survive over time • Three different trends • Type I: you’ll probably live until old age • Elephants: Few young, lots of care • Type II: you have an even chance to survive no matter how old • Type III: you’ll probably die young, but if you survive you’ll live to an old age. • Insects: Many young, little care
Explain how populations can be the same size but have different densities • It depends on both the number of people and on space. Two populations with the same number can have different numbers depending on the space.
Even distributions result when organisms attempt to get as far away from each other as possible. Carnivores have well defined territories that keep individuals apart. Stay out of my territory Explain why even distributions usually result from social interactions between individuals
Why might natural selection favor a high reproductive rate in Type III organisms? • Though many young die the surviving young are well adapted to the environment • More young also means more variation
Define Birth Rate • Number of births over a period of time • Define Death Rate • AKA mortality Rate • Number of deaths over a period of time
Flocks are too numerous, widespread and mobile. Tagging individuals is one solution Find a bottle neck Count numbers passing over a period of time Counting a herd of zebras can be tough Explain two difficulties an ecologist might have in counting a population of migratory birds. Develop & explain a method for estimating the size of such a population