Download
1 / 4
40 likes | 59 Views
UK LCG Operations. The Geographical Distribution of GridPP Institutes. GridPP is a collaboration of 19 UK Universities (RAL & Daresbury) and CERN. It is funded by the Particle Physics and Astronomy Research Council (PPARC). The project has two stages of funding:

E N D
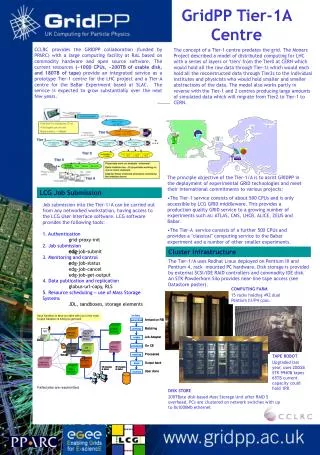
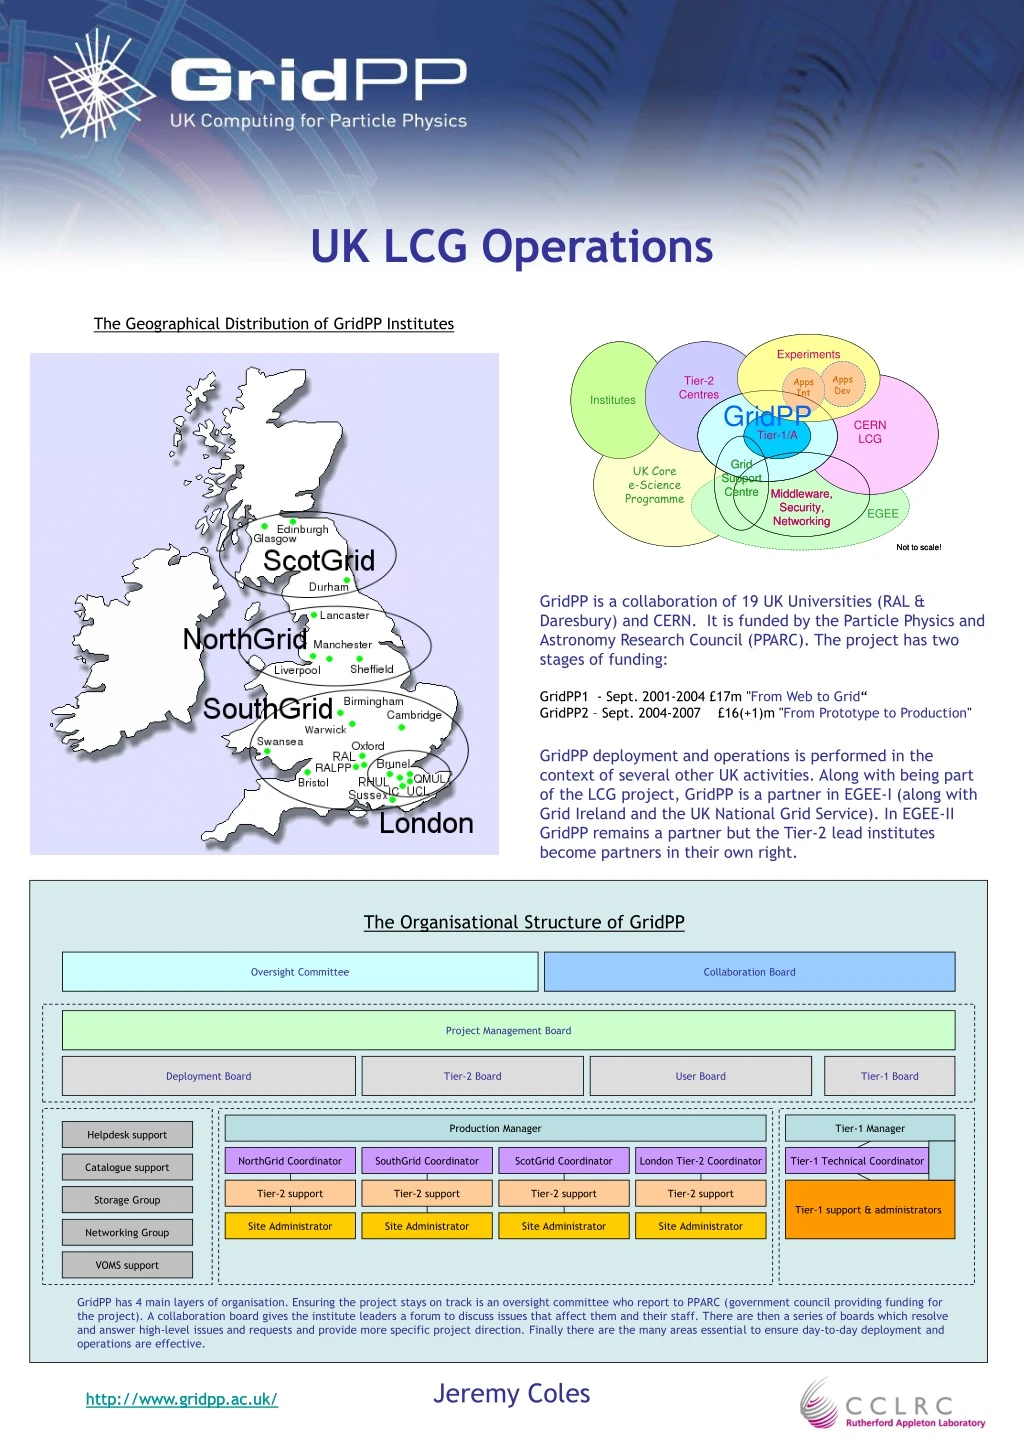
UK LCG Operations The Geographical Distribution of GridPP Institutes GridPP is a collaboration of 19 UK Universities (RAL & Daresbury) and CERN. It is funded by the Particle Physics and Astronomy Research Council (PPARC). The project has two stages of funding: GridPP1 - Sept. 2001-2004 £17m "From Web to Grid“ GridPP2 – Sept. 2004-2007 £16(+1)m "From Prototype to Production" GridPP deployment and operations is performed in the context of several other UK activities. Along with being part of the LCG project, GridPP is a partner in EGEE-I (along with Grid Ireland and the UK National Grid Service). In EGEE-II GridPP remains a partner but the Tier-2 lead institutes become partners in their own right. The Organisational Structure of GridPP Oversight Committee Collaboration Board Project Management Board Deployment Board Tier-2 Board User Board Tier-1 Board Tier-1 Manager Production Manager Helpdesk support NorthGrid Coordinator SouthGrid Coordinator ScotGrid Coordinator London Tier-2 Coordinator Tier-1 Technical Coordinator Catalogue support Tier-2 support Tier-2 support Tier-2 support Tier-2 support Tier-1 support & administrators Storage Group Site Administrator Site Administrator Site Administrator Site Administrator Networking Group VOMS support GridPP has 4 main layers of organisation. Ensuring the project stays on track is an oversight committee who report to PPARC (government council providing funding for the project). A collaboration board gives the institute leaders a forum to discuss issues that affect them and their staff. There are then a series of boards which resolve and answer high-level issues and requests and provide more specific project direction. Finally there are the many areas essential to ensure day-to-day deployment and operations are effective. Jeremy Coles • http://www.gridpp.ac.uk/
Metrics & Performance Monitoring 3. The ordering of sites according to the amount of Scheduled Downtime recorded in the GOC database. Some sites recorded themselves as down over the Christmas period causing their December figures to be large. Other sites like Manchester have been undertaking a lot of internal restructuring. 1. The GridPP contribution of resources to EGEE (job slots) has increased steadily since June 2004. Deployed resources are expected to increase more rapidly during 2006 as funding and procurement cycles show results. 2. The red bars show the relative percentage contribution for Q4 2005 to the total GridPP Tier-2 processing. The blue bars provide an indication of the occupancy for each site. This is calculated using published figures for the effective KSI2K available at each site over the Q4 period. Investigations into the differences started recently. 6. The growth of storage at the Tier-2 sites can be seen in this plot of disk deployed against time. GridPP is now actively working with the experiments to make better use of this available disk capacity and take the pressure off of the Tier-1 resources. The irregular fluctuations are mostly due to being unable to contact site BDIIs (updates every 10 mins). 4. Observed job usage across the CEs (from RB data) with job time plotted on a log scale to reveal detail about usage (but note the omission of a significant amount of ATLAS production work which does not show up in the RB logging and book keeping). The failure rate for one Birmingham CE (middle of plot) was traced to hardware problems. 5. Calculated site efficiencies on the basis of total successful job running vs total job running time. This is a graphical form of data shown in Table 1. “epbf004” at Birmingham was being implemented for pre-production service work (not the production service). 7. This table shows how VOs are currently supported across each of the GridPP sites. The colours correlate with the Tier-2 to which the site belongs (except for RAL Tier-1). GridPP sites have been encouraged to widely support EGEE VOs so that free CPU cycles are used. As the LHC experiments start making more use of the infrastructure, more careful consideration will be given to the individual allocations for the VOs at the sites. Within GridPP the User Board and Tier-2 Board will agree on how allocations for CPU and disk are be set. 8. The distribution of and relative use by VO jobs across the GridPP sites for Q4 2005. LHCb has a clear submission across all of its supporting sites while ATLAS work tends to be more targeted. GridPP deployment activities will examine the underlying reasons for the distribution (experiment software availability, disk and CPU limitations etc.) Jeremy Coles
GridPP Tier 2 SC4 File Transfer Tests BABAR ATLAS BIOMED CMS Receiving DZERO RAL Tier-1 Lancaster Manchester Edinburgh Glasgow Birmingham Oxford RHUL Durham QMUL IC-HEP RAL-PPD RAL Tier-1 ~800Mb/s 350Mb/s 156Mb/s 166 Mb/s 289 Mb/s 252 Mb/s 84Mb/s 397 Mb/s Lancaster Manchester 150 Mb/s ZEUS Edinburgh 440Mb/s 224 Mb/s Glasgow 331Mb/s 122 Mb/s 317 Mb/s 59 Mb/s 88 Mb/s 80 Mb/s Birmingham 461 Mb/s LHCb IC-HEP Oxford 456 Mb/s 59 Mb/s RHUL Durham QMUL IC-HEP RAL-PPD 388 Mb/s Activities & Planning Some of the high-level GridPP deployment milestones SRM - 80% of sites have working (file transfers with 2 other sites successful) SRM by end of December - All sites have working SRM by end of January - 40% of sites (using FTS) able to transfer files using an SRM 2.1 API by end February - All sites (using FTS) able to transfer files using an SRM 2.1 API by end March - Interoperability tests between SRM versions at Tier-1 and Tier-2s (TBC) FTS Channels - FTS channel to be created for all T1-T2 connections by end of January - FTS client configured for 40% sites by end January - FTS channels created for one Intra-Tier-2 test for each Tier-2 by end of January - FTS client configured for all sites by end March Data Transfers - Tier-1 to Tier-2 Transfers (Target rate 300-500Mb/s) - Sustained transfer of 1TB data to 20% sites by end December - Sustained transfer of 1TB data from 20% sites by end December - Sustained transfer of 1TB data to 50% sites by end January - Sustained transfer of 1TB data from 50% sites by end January - Sustained individual transfers (>1TB continuous) to all sites completed by mid-March - Sustained individual transfers (>1TB continuous) from all sites by mid-March - Peak rate tests undertaken for all sites by end March - Aggregate Tier-2 to Tier-1 tests completed at target rate (rate TBC) by end March Inter Tier-2 Transfers (Target rate 100 Mb/s) - Sustained transfer of 1TB data between largest site in each Tier-2 to that of another Tier-2 by end February - Peak rate tests undertaken for 50% sites in each Tier-2 by end February LCG File Catalog - LFC document available by end November - LFC installed at 1 site in each Tier-2 by end December - LFC installed at 50% sites by end January - LFC installed at all sites by end February - Database update tests (TBC) VO Boxes - Depending on experiment responses to security and operations questionnaire and GridPP position on VO Boxes. - VOBs available (for agreed VOs only) for 1 site in each Tier-2 by mid-January - VOBs available for 50% sites by mid-February - VOBs available for all (participating) sites by end March For the GridPP project plan please see:http://www.gridpp.ac.uk/pmb/ProjectManagement/GridPP2_ProjectMap_2.htm One of the main recent activities in GridPP has been deploying an SRM at each site, and then testing the transfer capabilities between sites. Some of the main test results are shown in the table on the right.Figures in light blue were for a less than 1TB file transfer and the dark blue numbers are for a 1TB file transfer. While the Tier-1 was occupied with SC3 rerun activities, and to ease the load generally, Glasgow was set up as a secondary reference site. Some of the sites are clearly limited by their site bandwidth (Brunel & RHUL have 100 Mb/s) while others benefit from a UKLight connection (Lancaster). The site SRM configuration also has an impact as do the parameters used for the transfer such as the number of streams. The results and findings are being recorded to GridPP wiki pages to help guide other sites. For more information please see: http://wiki.gridpp.ac.uk/wiki/Service_Challenge_4 RAL Tier-1 took part in LCG Service Challenge 3. The highest rates achieved by RAL for the rerun can be seen in this plot. One of the main 2005 activities was increasing the stability of sites and increasing the number of supported VOs. The end result was over 4 million KSI2K hours of processing by the combined Tier-1 and Tier-2 resources. The distribution amoung the VOs based on APEL accounting is shown below. Jeremy Coles [edit] Table Format
RAL Tier-1 Occupancy and Job Efficiencies Occupancy Farm occupancy increased during 2005, and a diverse mix of Grid and non-Grid jobs was run. Full capacity was reached for extended periods, notably during the whole of December, including the Christmas period (when the farm was running “at risk”, due to the low level of maintenance). Efficiencies Job efficiencies for each VO are defined as: sum(CPU time) / sum (wall time). The data shown here are taken from an accounting database (MySQL) but the scripts can be adapted to use APEL data to faciliate wider deployment as is planned in the UK. (For most of 2005, ALICE ran no work at RAL.) The low efficiencies around April and May were due to problems with the storage element in this period (during an ATLAS data challenge). In the second half of the year, efficiencies were high for ATLAS and LHCb, though CMS ran some low-efficiency work. Scatter plots (see example below) reveal further information. Vertical structures indicate jobs running for a constant CPU time; other lines through the origin indicate jobs running for constant wall time. In either case, jobs may not be terminating correctly This table shows the efficiencies for supported VOs at the Tier-1 for each month in 2005. A plot for the LHC VOs can be seen on the left. Future Work Monitoring of the farm occupancy is continuous. Efficiencies are at present calculated at the end of each month, and additional monitoring is being considered so that quick intervention to improve job efficiencies can be done by interaction with the experiments. Jeremy Coles