Download
1 / 32
320 likes | 454 Views
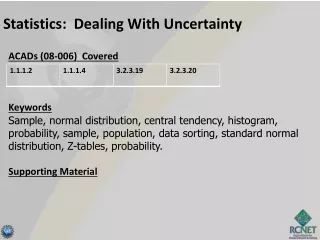
Introductory Statistics for Laboratorians dealing with High Throughput Data sets. Centers for Disease Control. Interpreting Scores. What do the numbers mean?. Johnny came home from 4 th grade and told his mother he’d made 100 on his test. That’s good! But it was a 200 point test.

E N D
Introductory Statistics for Laboratorians dealing with High Throughput Data sets Centers for Disease Control
Interpreting Scores What do the numbers mean?
Johnny came home from 4th grade and told his mother he’d made 100 on his test. • That’s good! • But it was a 200 point test. • That’s bad! • But it was a very difficult test and Johnny’s score was one of the highest in the district. • That’s good! • But Johnny wasn’t the only one who got 100, the average score on the test was 100. • That’s not so good.
What have we learned? • The fact is that a raw score by itself is meaningless. • To interpret a persons score you must know how everybody else scored. • For a score to have meaning, you have to know where that score is in the distribution.
The two main things we need to know to interpret a score are: • How far is is from the mean • How spread out are the scores
The Deviation Score • Deviation score commonly used in statistics to make a score more interpretable. • Deviation score: how far the score is from the mean
Some Notation • In statistics the raw score is symbolized by a UPPER CASE • The mean of the raw scores is symbolized by • The deviation score is symbolized by a lower case • The deviation score is computed by subtracting the mean from the score:
If someone scores at the mean, the deviation score would be zero. • If someone scores above average, the deviation score will be a positive number. • If the score is below the mean the deviation score will be a negative number
If Johnny had come home and told his mother that his deviation score on the test was 0, she would have known immediately that he was average. • (Johnny’s mother is a professor of statistics at the local college)
But that is not all. • While the distance a persons score is from the mean is more meaningful than the raw score, the interpretation of the distance from the mean depends on how spread out the scores are.
The importance of Dispersion • For example, if Johnny tells his mother he scored 10 points above the mean on a test, we know right away that he is above average. • Question is, how much above average.
If the average score on the test is 55 and Johnny scores 65 and that is the highest score on the test then scoring 10 points above the mean is very good. (see figure1)
If on the other hand, the highest score on the test is 100, then a 65 is not so great.
So? • What we really need is a way to express a score that takes into account both how far the score is from the mean and how spread out the scores are.
z-Scores • The standard deviation is the parameter that measures the dispersion or spread of the distribution. • z-scores measure the distance from the mean in standard deviation units.
z-Scores • If a person scores 1 standard deviation (SD) above the mean, the z-score will be +1 • If they score 1 SD below the mean the z-score will be –1 • If they score 2 SD’s above the mean the z-score will be +2 • If they score at the mean the z-score will be zero. • Etc.
Areas Under the Normal Curve • The proportion of the area under the normal curve can be interpreted as the probability that a score appears in that area. • Areas here are shown for standard deviation units.
Areas Under the Curve • As shown here, the percentage of the distribution in a standard deviation band is the same regardless of the shape of the distribution
N(64.5, 2.5) N(0,1) => Standardized height (no units) Using the Standard Normal Distribution • Because all Normal distributions share the same properties, we can us the standard normal distribution (the distribution of z-scores) for our computations and get the same results. • In the distribution with mean of 64.5 and standard deviation of 2.5, 68% of the distribution is between 62 and 67 (-1 SD to +1 SD). • In the standard normal distribution (with mean 0 and standard deviation 1), 68% of the distribution is between -1 SD and +1 SD.
Problem 12: Women’s Heights • The average woman is 64.5 inches tall. • Mean = 64.5 • Standard Deviation = 2.5
Problem 12: Women’s Heights • Maria is 67 inches tall (5’ 7”). • What is Maria’s z-score? • What percent of women are shorter than Maria? • What percent are taller?
Problem 12: Women’s Heights • Alexis is 62 inches tall (5’ 2”). • What is Alexis’ z-score? • What percent of women are shorter than Alexis? • What percent are taller?
Problem 12: Women’s Heights • Barbie is 69.5 inches tall (5’ 9.5”). • What is Barbie’s z-score? • What percent of women are shorter than Barbie? • What percent are between Alexis and Barbie?
Problem 12: Women’s Heights • Leela is 68 ¾ inches tall (5’ 8 ¾ ”). • What is Leela’s z-score? • Can we compute the percent of women who are shorter than Leela? • Why or why not?
Problem 12: Women’s Heights • Leela is 68 ¾ inches tall. • Her z-score is 1.5 • Use http://davidmlane.com/hyperstat/z_table.htmlto compute the percent of women who are shorter than Leela.
Problem 12: Women’s Heights • How tall do you have to be to be taller than 50% of the women? • How tall do you have to be to be taller than 84% of the women? • How tall do you have to be to be taller than 97.6% of the women?
Problem 12: Women’s Heights • Use http://davidmlane.com/hyperstat/z_table.htmlfor the following problems: • How tall do you have to be to be taller than 95% of the women? • How tall do you have to be to be taller than 99% of the women? • We can be sure that 95% of the women are between what heights?
Problem 13 • Use http://davidmlane.com/hyperstat/z_table.html for the following problem: • You have been timing how long it takes to get to work in the mornings. The mean is 22.6 minutes with a standard deviation of 8.16 minutes. • You have to be at work at 8:30 am at the latest. • How many minutes before 8:30 do you have to leave to be 95% confident that you will get there at or before 8:30? • When do you have to leave to be 99% sure you’ll be there by 8:30?