Download

1 / 11
110 likes | 207 Views
This study investigates using elastic light scattering measurements to diagnose high-grade squamous intraepithelial lesions (HSIL) in the cervix. A fiber optic probe was used to measure light transport in 36 patients, with spectroscopic parameters like SP1, SP2, and SP3 analyzed using MANOVA. Results show promising utility of light scattering for HSIL discrimination, compared with fluorescence methods.

E N D
Introductory Statistics for Laboratorians dealing with High Throughput Data sets Centers for Disease Control
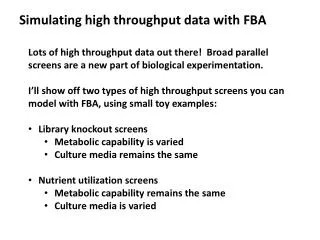
Light Scattering Measurements for Detection of Precancerous Conditions of the Cervix. • Objective: To examine the utility of in vivo elastic light scattering measurements to diagnose high grade squamousinterepithelial lesions (HSIL) of the cervix. • Methods: A newly developed fiber optic probe was used to measure light transport in the cervical epithelium of 36 patients undergoing standard colposcopy. Both unpolarized and polarized light transport were measured in the visible and near-infrared.
Groups: Three groups of women were identified using histopathology of the measured sites: • Group 1: Women with HSIL • Group 2: Women with low-grade lesions and • Group 3: Women with normal tissue • Dependent Measures: Three spectroscopic parameters: • SP1 • SP2 • SP3
Analysis with ANOVA • ANOVA: • Three groups • 1 outcome/dependent variable • We have 3 Dependent Measures • Could do 3 ANOVA’s • But get 3 times the error rate
MANOVA • Provides one overall test for all the dependent measures combined • Creates a linear combination of the dependent measures and tests the significance of the combined variable • Treats the combined variable as a single dependent variable and does something similar to ANOVA on it.
MANOVA • The MANOVA tests the significance of the difference between the means of the W’s • Computer selects the b’s that make the difference between the means as large as possible • If it still isn’t significant you know none of the X’s are doing anything
MANOVA • Provides an overall test of the differences among the means of the groups on the combined variable. • Provides tests of the significance of each of the b’s. If the b for a particular X variable is not significantly different from zero, that X variable isn’t doing anything • Provides the equation for the optimal combination of the variables. May lead to the discovery of emergent variables. • Provides post hoc tests comparing the means of the groups on each variable
Results and Conclusions • Results: Three spectroscopic parameters are statistically different for HSIL compared with low-grade lesions and normal tissue. • Conclusions. : Reflectance measurements of elastically scattered light show promise as a non-invasive, real-time method to discriminate HSIL from other abnormalities and normal tissue. These results compare favorably with those obtained by fluorescence alone and by fluorescence combined with light scattering.