Dynamic Modeling
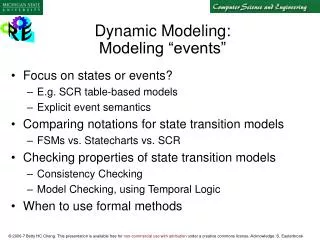
Dynamic Modeling. Dynamic Modeling with UML. Interaction diagram Dynamic behavior of a set of objects arranged in time sequence Interaction between objects State Chart diagram A state machine that describes the response of a given class to the receipt of outside stimuli

Dynamic Modeling
E N D
Presentation Transcript
Dynamic Modeling with UML • Interaction diagram • Dynamic behavior of a set of objects arranged in time sequence • Interaction between objects • State Chart diagram • A state machine that describes the response of a given class to the receipt of outside stimuli • Behavior of a single object
Sequence Diagram • From flow of events in use case, go to sequence diagram • Graphical description of objects in use case • Classes have already been found, but finds new classes • Each event passes a message between a sender object and a receiver object
Example • Establish connection between smart card and onboard computer • Establish connection between onboard computer and sensor for seat • Get current seat position and store on smart card
Sequence Diagram for “Get SeatPosition” Seat Onboard Computer Smart Card • 1. Establish connection between smart card and onboard computer • 2. Establish connection between onboard computer and sensor for seat • 3. Get current seat position and store on smart card Establish Connection Establish Connection Accept Connection Accept Connection Get SeatPosition “500,575,300” time
Heuristics for Sequence Diagrams • Layout: • 1st column: Should correspond to the actor who initiated the use case • 2nd column: Should be a boundary object • 3rd column: Should be the control object that manages the rest of the use case • Creation: • Control objects are created at the initiation of a use case • Boundary objects are created by control objects
Access: • Entity objects are accessed by control and boundary objects, • Entity objects should never call boundary or control objects: This makes it easier to share entity objects across use cases and makes entity objects resilient against technology-induced changes in boundary objects.
Is this a good Sequence Diagram? Seat Onboard Computer Smart Card • First column is not the actor • It is not clear where the boundary object is • It is not clear where the control object is Establish Connection Establish Connection Accept Connection Accept Connection Get SeatPosition “500,575,300”
:Tournament :Arena :League Boundary League Owner newTournament (league) :Announce «new» Tournament Control checkMax Tournament() setName(name) setMaxPlayers (maxp) create Tournament (name, maxp) commit() createTournament (name, maxp) «new» :Tournament An ARENA Sequence Diagram : Create Tournament
Impact on ARENA’s Object Model • Let’s assume, before we formulated the previous sequence diagram, ARENA’s object model contained the objects • League Owner, Arena, League, Tournament, Match and Player • The Sequence Diagram identified new Classes • Tournament Boundary, Announce_Tournament_Control
League Owner League 1 * Attributes Attributes Operations Operations Tournament Attributes Operations Player Match * * Attributes Attributes Operations Operations
Tournament_ Boundary Announce_ Tournament_ Control Attributes Operations Attributes Operations League Owner League 1 * Attributes Attributes Operations Operations Tournament Attributes Operations Player Match * * Attributes Attributes Operations Operations
Impact on ARENA’s Object Model (ctd) • The Sequence Diagram also supplied us with a lot of new events • newTournament(league) • setName(name) • setMaxPlayers(max) • Commit • checkMaxTournaments() • createTournament
Question: Who owns these events? • Answer: For each object that receives an event there is a public operation in the associated class. • The name of the operation is usually the name of the event.
:Tournament :Arena :League Boundary League Owner newTournament (league) :Announce «new» Tournament Control checkMax Tournament() setName(name) setMaxPlayers (maxp) create Tournament (name, maxp) commit() «new» :Tournament Example from the Sequence Diagram createTournament is a (public) operation owned by Announce_Tournament_Control createTournament (name, maxp)
Tournament_ Boundary Attributes Operations League Owner League 1 * Attributes Attributes Operations Operations Tournament Announce_ Tournament_ Control Attributes Operations Attributes createTournament (name, maxp) Player Match * * Attributes Attributes Operations Operations
What else can we get out of sequence diagrams? • Sequence diagrams are derived from the use cases. We therefore see the structure of the use cases. • The structure of the sequence diagram helps us to determine how decentralized the system is. • We distinguish two structures for sequence diagrams: Fork and Stair Diagrams (Ivar Jacobsen)
Fork Diagram • Much of the dynamic behavior is placed in a single object, ususally the control object. It knows all the other objects and often uses them for direct questions and commands.
Stair Diagram • The dynamic behavior is distributed. Each object delegates some responsibility to other objects. Each object knows only a few of the other objects and knows which objects can help with a specific behavior.
Fork or Stair? • Which of these diagram types should be chosen? • Object-oriented fans claim that the stair structure is better • The more the responsibility is spread out, the better • However, this is not always true. Better heuristics:
Decentralized control structure • The operations have a strong connection • The operations will always be performed in the same order • Centralized control structure (better support of change) • The operations can change order • New operations can be inserted as a result of new requirements
UML Statechart Diagram Notation Event trigger With parameters State1 State2 Event1(attr) [condition]/action do/Activity Guard condition entry /action exit/action Also: internal transition and deferred events
Notation based on work by Harel • Added are a few object-oriented modifications • A UML statechart diagram can be mapped into a finite state machine
Statechart Diagrams • Graph whose nodes are states and whose directed arcs are transitions labeled by event names. • We distinguish between two types of operations in statecharts: • Activity: Operation that takes time to complete • associated with states • Action: Instantaneous operation • associated with events • associated with states (reduces drawing complexity): Entry, Exit, Internal Action
A statechart diagram relates events and states for one class • An object model with a set of objects has a set of state diagrams
State • An abstraction of the attributes of a class • State is the aggregation of several attributes a class • Basically an equivalence class of all those attribute values and links that do no need to be distinguished as far as the control structure of the system is concerned • Example: State of a bank • A bank is either solvent or insolvent • State has duration
coins_in(amount) / set balance Collect Money Idle coins_in(amount) / add to balance cancel / refund coins [item empty] [select(item)] [change<0] do: test item and compute change [change>0] [change=0] do: dispense item do: make change Example of a StateChart Diagram
Headlight Off power power on off On Toy Car: Dynamic Model Wheel Forward power power off on Stationary Stationary power power on off Backward
State Chart Diagram vs Sequence Diagram • State chart diagrams help to identify: • Changes to an individual object over time • Sequence diagrams help to identify • The temporal relationship of between objects over time • Sequence of operations as a response to one or more events