Download
1 / 38
430 likes | 638 Views
HIGHLY NONLINEAR FIBERS FOR RAMAN AMPLIFICATIONS: FABRICATION, ISSUES AND CHARACTERIZATION. by Nitin Kumar Goel. LOSS MEASUREMENT AND EXPLANATION. DISTRIBUTED GAIN BEHAVIOR. RAMAN AMPLIFICATION. CALCULATION AND MEASUREMENT OF RAMAN GAIN. HIGHLY NONLINEAR FIBERS (HNLFs). FABRICATION.

E N D
HIGHLY NONLINEAR FIBERS FOR RAMAN AMPLIFICATIONS: FABRICATION, ISSUES AND CHARACTERIZATION by Nitin Kumar Goel
LOSS MEASUREMENT AND EXPLANATION DISTRIBUTED GAIN BEHAVIOR RAMAN AMPLIFICATION CALCULATION AND MEASUREMENT OF RAMAN GAIN HIGHLY NONLINEAR FIBERS (HNLFs) FABRICATION CHARACTERIZATION TWO-WAY MEASUREMENT SCHEME CRUCIBLE TECHNIQUE CORE SUCTION TECHNIQUE OPTICAL FREQUENCY DOMAIN REFLECTOMETER (OFDR)
Power l0 l0 +Dl Wavelength Raman Amplification: Basics • Raman effect: An interaction between light and a • material (like a glass fiber) • Causes some of the light to be shifted to a different, • usually longer wavelength (Stokes Shift). l0 Raman Medium l0 l0 +Dl
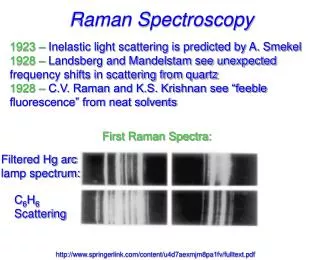
Power Wavelength Raman Amplification: Basics (Contd..) ~1525 nm ~ 1423 nm Spontaneous Raman Gain Spectrum of Standard Fiber
P Raman Medium S Raman Amplification Power P S l0 l0 +Dl Wavelength Raman Amplification: Basics (Contd..) Stimulated Raman Scattering: If low power signal at Stokes wavelength is present with high power pump Signal will be amplified at the cost of pump Raman Amplifier Schematic of a Simple Raman Amplifier
Raman Amplification: Basics (Contd..) • Raman Amplifier is a promising technology for current and future optical networks. • Transmission fiber line itself acts as an amplifying medium, no additional doping is required. • Transmission fiber can be Standard fiber, Dispersion Shifted fiber (DSF), or Dispersion Compensated fiber (DCF). So one needs a tool by which one can predict the Raman Gain behavior of different fiber types (different refractive index profile, different Ge-doping).
P S Raman Amplification: Basics (Contd..) Raman amplification is the ratio of output powers with the pump on and off gR - Raman gain Coefficient P0 - Pump power Leff - (1-e-aL)/a a - Attenuation coefficient L - Fiber length Aeff - Effective area Measurement gives g/Aeff
What is needed for accurate Raman Gain • There is a big discrepancy in published data for Raman Gain in different fibers • The fiber over which measurements are made is not the same as the one on which the calculations are made. • The fiber profile over which calculations are based, is not the ACTUAL fiber profile (index dip etc.) • Measurement gives g/Aeff • Aeff using fields at pump or signal doesn’t give correct value for g. Aeff for Raman Gain is: p, s are the mode fields at the pump and signal wavelengths.
Effect of Ge-doping • Ge-doping raises the Raman Gain • Ge concentration varies across the core So g = g (r) • Mode field penetrates into the cladding • Effective Raman gain is some average over the doping profile • Proper way to include the effect of Ge- doping is to include g(r) in the calculation of overlap integral p, s are the mode fields at the pump and signal wavelengths.
Measure Fiber Profile Calculate Ge-Concentration at each point across the Core Calculate Mode Field Profile at Signal and Pump Wavelength p ands Calculate Raman Gain Coefficient g (.r) at each point across the Core Calculation of Raman Gain
Calculation of Raman Gain (Contd…) Standard Step Index Fiber Dispersion Shifted Fiber • Triangular Index • Ge-doped Silica core made • from MCVD process. • Peak index diff. - 0.0097 • MFD – 8.64 mm • Ge-doped silica Core made from VAD • No index dip at the center of the core. • Highly Uniform along the length • Core diameter – 8.3 mm • Index difference- 0.0051 g/Aeff = 5.18x10⁻⁴ m-1 W-1 g/Aeff = 10.3x10⁻⁴ m-1 W-1
FIBER WDM COUPLER ISOLATOR SIGNAL OSA PUMP Measurement of Raman gain Amplified Signal EXPERIMENTAL SETUP
Summary and Future Directions • Raman gain was estimated for STF and DSF. • Ge-doping effect was taken into account by taking g(r) into overlap integral. • Estimated and measured values for Raman gain (g/Aeff) • are in excellent agreement for STF. • For DSF use the actual profile for the calculation. • Apply same technique to other Ge-doped fibers like DCF, and other high Ge-doped fibers.
Raman Amplification Highly Nonlinear Fibers (HNLFs) • Motivation for HNLFs • Requirement of Much Higher Raman Gain • Requirement of Ultra wide band Raman Amps For Large Raman Amplification 1) Increase Raman gain coefficient gR Dope the Core with highly nonlinear material like GeO2,TeO2 2)Decrease Effective Area – Aeff Highly NL materials usually associated with reduction in Aeff
Highly Nonlinear Fibers (HNLFs) Contd… Germania (GeO2) based HNLF: • Effect of GeO2-doping • Ge-doping increases the Raman gain • GRcan be upto 10 times of Silica • => DCF have largest gain among STF, DSF, DCF • Effect of Effective Area (Aeff) • SmallerAeff gives the larger gain STF-82 mm2 DSF-55 mm2 DCF-15 mm2 DCF has the Largest Gain among STF, DSF, and DCF
l l PUMPS FIBER WDM COUPLER OSA SIGNAL l4 l3 l2 l1 Ultra Wideband Raman Amplifier • Shifting the Pump will shift the whole Raman Spectrum. Raman Gain over whole spectrum ofSilica can be achieved at with the appropriate pump wavelength • Ultra Wideband Amplification • Difficult, Expensive • Smart way:Fiber with the large Raman Gain over wideband Tellurite (TeO2) based HNLF
Highly Nonlinear Fibers (HNLFs) Contd… Tellurite (TeO2) based HNLF: Tellurite based fiber GeO2 based fiber • Peak Raman gain ~ 16 times of DCF (GeO2 based fiber) • Spectral Range of ~ 1.7 times of DCF (GeO2 based fiber) Tellurite HNLF are the best solution for HIGH gain UltraWide Band RAmps
Highly Nonlinear Fibers (HNLFs) Contd… • Fabrication of GeO2/TeO2 Based HNLFs • Crucible Technique • Core Suction Technique • Initial Results • Summary and Future Plans
Silica Tube High Nonlinear Glass Fabrication of HNLFs Core Preform Overcladding Crucible Technique
TO VACCUM PUMP CLADDING TUBE MUFFLE FURNACE ALUMINA CRUCIBLE WITH CORE MATERIAL Fabrication of HNLFs (Contd…) Core Preform Overcladding Core Suction Technique
Fabrication of HNLFs (Contd…) Hole at the center of the Fiber core, Uncollapsed tube Solid Core Fiber formed from the collapsed tube Fibers made by Core Suction Technique
Summary and Future Directions • Initial trials with pure GeO2 and pure TeO2 powders and Schott glass as core materials in silica cladding tubes were made • During Over-cladding (while cooling) preform cracked possibly because of the stresses that developed at the interface • Using “Core Suction technique” several preforms were made • Although no usable lengths so far but the initial results are encouraging. • Developing a “Core Suction Technique”, shows potential for HNLFs. Future Plans: • Trials with thicker walled silica cladding tubes, no need of over-cladding • Pull the fiber on the vertical lathe itself, before the preform cools down
Characterization of HNLFs • Characterization of Fibers by Backscattering Technique • OTDR and OFDR • Two way Measurement Scheme • Separation of Fiber Loss and the Fiber Fluctuations using OFDR • Proposed experiments using OFDR on GeO2 fibers and HNLFs • Loss measurement and the “anomalous” loss explanation • Distributed Raman gain behavior in HNLF • Summary /Future Directions
Optical Time Domain Reflectometer (OTDR) Schematic Diagram of an OTDR
Reflective Event (Spike) Non-Reflective Event (Dip) OTDR (Contd…) Connector, break, open ends Some loss but no reflection But what if ???? • Non uniformity in fibers • Diameter variation along the length or at some point • Local in-homogeneities (doping variation, index fluctuation)
Two-way Measurement Scheme Back Scattered Power P(Z0) received from a point Z0 in a fiber: and S(Z)=10Log10P(Z) P0 Power Launched into the fiber s(Z0) Local Scattering Coefficient (mainly Rayleigh and in-Homogenity effect) B(Z0) Back-scattered capture fraction at Z0 (Z) Attenuation Coefficient of the fiber • If we can separate the different components of the fiber signature we can get information about the fiber uniformity
Fiber Fluctuations Contribution Power Decay Contribution (Loss) where Components of the Fiber Signature Forward Signature Backward Signature Fluctuation term can further be related to the MFD variation or index variation
Two-way Measurement Scheme (Contd…) Components of OTDR trace for a non-Uniform Fiber
Summary: Two-way Measurement Scheme • Using two-way measurement scheme It is possible to separate the fiber loss from the fiber fluctuation in a fiber signature from OTDR. • Measurement shows good agreement with the estimations of variation of various Fiber parameters along the fiber length at least qualitatively. Limitations of OTDR: • Length resolution is of the order of meter • Sensitivity is not that high (can’t see extremely small fluctuations) Optical Frequency Domain Reflectometer (OFDR)
• Length Range : 80 m • Dynamic Range : 100 dB • Sensitivity : -130 dBm. • Length Resolution : 40 µm Advantage of OFDR over OTDR PROTOTYPE OFDR SPECIFICATIONS • OFDR will work great for very short fiber lengths (mainly in HNLF) • High Sensitivity-so high loss fiber can be accommodated and very • minute fluctuations can be recorded • Extremely high length resolution can make it possible to see • variations within very small fraction of the fiber
Optical Frequency Domain Reflectometer (OFDR) Schematic Diagram of an OFDR
Proposed Experiments using OFDR • Experiments on Ge-doped Fibers: • Aim:To understand/find out the reasons for high loss in Ge-doped fibers • Run OFDR on Z-Plus (Pure Silica),STF, DSF,Truewave and DCF • Use Two-way measurement scheme for each Individual fiber • (Separate loss term from the fiber fluctuations) • Compare pure silica core fiber with High Ge-Core fibers • Splice pieces of different fibers and run OFDR, compare the Signatures • Use two-way measurement scheme (Separate loss term from the fiber fluctuations) • Compare the signatures in different types of fibers (light going from High NA to Low • NA and vice versa) • Splice different combinations of the fibers and repeat the same
Proposed Experiments using OFDR (Contd..) Experiments on High Nonlinear Fibers (HNLFs): Aim: To measure the Distributed Raman Gain in HNLF and to analyze Rayleigh Back Scattering for the Noise purpose in Raman Amplifiers. • Run OFDR on HNLF • Use Two-way measurement scheme for HNLF • (Separate loss term from the fiber fluctuations) • Analyze each term and see the wavelength behavior • (get Fiber Signatures at different wavelength bands) • Measure Distributed Raman Gain in HNLF • (Distributed Gain in Erbium Fibers already measured and • shows promising results)
Proposed Experiments using OFDR (Contd..) Schematic of Distributed Gain Measurement in HNLFs Distributed Gain in Erbium Fiber
Summary • We will be able to have a better understanding of the high loss in Ge-doped fiber • Fiber loss and fluctuation terms can be separated locally which gives us ability • to interpret Fiber properties more accurately and precisely. • Distributed Raman Gain in HNLF can be measured very accurately and precisely • Consistency and Homogeneity of doping elements along the fiber can be seen. • Two way measurement scheme enable us to determine whether the local gain is • the fiber doping material property or the fiber uniformity/non-uniformity • As a byproduct, possible mismatches between the NA of the active fiber and the • preceding/following fibers can be detected. • All this info. must be very useful in improving the manuf. process for doped fibers, designing inexpensive fiber lasers and amplifiers for much better performance.
Simple Raman Amplifier • Put a high pump and low signal together in the same medium (fiber) • Choose Signal wavelength at Stokes Wavelength • Signal amplifies by the process of Stimulated Raman Scattering. => Raman Amplifier Schematic of a Simple Raman Amplifier