Download
1 / 40
400 likes | 455 Views
This study examines the location and attendance patterns of high schools that produce the nation's dropouts. It highlights the factors contributing to dropout rates, such as poor prior preparation, attendance issues, and course failure. The research also emphasizes the disproportionate representation of minority students in low-performing high schools. Policy implications and the challenges of transforming these schools are discussed.

E N D
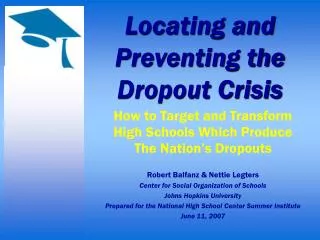
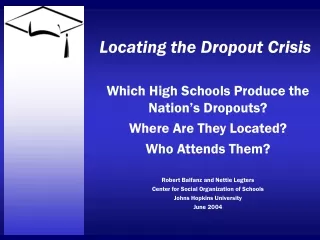
Locating the Dropout Crisis Which High Schools Produce the Nation’s Dropouts? Where Are They Located? Who Attends Them? Robert Balfanz and Nettie Legters Center for Social Organization of Schools Johns Hopkins University June 2004
Background • CRESPAR • Talent Development High Schools • Markers of Low Performing High Schools • Poor prior preparation • Poor attendance, high mobility • Large, impersonal organization • Massive course failure • Low promotion, high dropout, and low graduation rates
Where Did All TheFreshmen Go? 12th Graders 197 11th Graders 259 10th Graders 327 9th Graders 484 Number of 9th Graders in 1996/97 = 669 % Fewer 12th graders in 1999/2000 than 9th graders 1996/97 = 71%
Promoting Power Twelfth grade enrollment Yr X Ninth grade enrollment Yr X-4 • Is it a perfect estimate of dropout/graduation rates? • Is it a good first order indicator of a low performing high school, easily calculable and using readily available data? • Does it address NCLB guidelines? • Harvard Civil Rights Project Forums 2001, 2003
How Many High Schools Have Weak Promoting Power? • 900-1,000 High Schools have Promoting Power of 50% or less • About 2,000 High Schools have Promoting Power of 60% or less
The Number of High Schools with Weak Promoting Power Grew During the 1990’s
The Gap Between HS’s with Weak Promoting Power and the National Norm is a striking 40 to 60 Percentage Points
Who Attends High Schools that Produce the Nation’s Dropouts?
High Schools with Weak Promoting Power are Overwhelmingly Majority Minority • A Majority Minority HS is Five Times More Likely to have Weak Promoting Power Than a Majority White School
50 Years After Brown vs Board of Ed, 46% of African American, 39% of Latino, and 11% of White Students Attend High Schools with Weak Promoting Power (60% or less)
Not All Majority Minority HS’s Have Weak Promoting Power. Two Notable Exceptions Are: • Selective Admission High Schools in Large Cities • Majority Minority HS’s in Affluent Suburbs
High Schools with Weak Promoting Power Are Located in a Sub-set of the Nation’s Cities and States • 80% of the High Schools that have the lowest levels of promoting power (50% or less) and produce the highest numbers of dropouts are located in just 15 states Arizona Louisiana North CarolinaCalifornia Michigan Ohio Florida Mississippi Pennsylvania Georgia New Mexico South Carolina Illinois New York Texas
43% of the High Schools with the lowest levels of promoting power are located in Just 34 Cities
In Some Cities Students Have Virtually No Other Choice but to Attend a High School with Weak Promoting Power
In Northern Industrial States Weak Promoting Power Schools Are Almost Exclusively Attended by Minority Students and Located in Large and Medium Size Cities
In the South, Weak Promoting Power High Schools Can be Found in High Numbers Throughout the States
Policy Implications Good News • Manageable number of schools and we can locate the bulk of the work • Converging discourse on what needs to be done • Increasing level of know how • Leadership and support
Policy Implications Bad News Transforming low performing high schools and systems is not easy, fast, or cheap
Not Easy • Need comprehensive and systemic approach to avoid isolated efforts that exacerbate inequity • Consider multiple approaches as appropriate to context • Develop and scale-up technical and human supports for transformation • Align federal, state, district, and school-based efforts
Not Fast “The trick is how to sustain interest in a reform that requires a generation to complete.” Debbie Meyer NCLB & States must acknowledge reality and progress using multiple indicators
Not Cheap • Continue and expand public and private funding • Institutionalize targeted resources • Title I • Perkins
Center for Social Organization of Schools, Johns Hopkins University www.csos.jhu.edu 410-516-8800