Download

1 / 25
250 likes | 372 Views
Colorado’s Dropout Crisis: Size, Scope, Costs and Implications. May 13, 2013. Note:

E N D
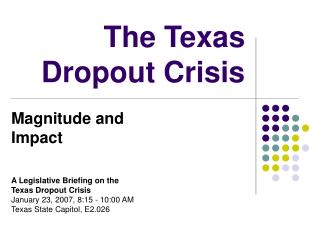
Colorado’s Dropout Crisis: Size, Scope, Costs and Implications May 13, 2013
Note: Many of the slides in this PowerPoint presentation contain overlapping animation. The presentation is therefore best viewed as a slide show. Select the “Slide Show” tab at the top of your screen, then click on “From Current Slide”. Use the left and right arrow keys on your keyboard to advance through the slides and through the animation on each slide.
Is it really a crisis? • Scope, cost and context
Context for Colorado’s dropout rates and numbers Statewide Annual Dropout Rate The Pepsi Center Seating Capacity: 18,007 Red Rocks Amphitheatre Seating Capacity: 9,450 5% 4.5% 4.4% 4% 3.8% 3.6% 3.1% 3.0% 2.9% 3% 18,031 18,027 15,524 14,975 2% 13,147 12,744 12,256 1% 0% 2005-06 2006-07 2007-08 2008-09 2009-10 2010-11 2011-12 4
Personal and Social Costs of Dropping Out • Over a 45 year career, compared to a dropout*: • a high school graduate will earn an additional $433,530 • a bachelor’s degree recipient will earn an additional $1,591,740 • Less than 46 percent of the nation’s young high school dropouts were employed on any given day during 2008 - an average joblessness/unemployment rate of 54%.** • The incidence of institutionalization problems among young high school dropouts is 6.3 times higher than among young high school graduates. Nearly 1 of every 10 young male high school dropouts was institutionalized on a given day in 2006-2007.** • * Source: “US Bureau of the Census, 2006 • ** Source: “The Consequences of Dropping Out of High School” by The Center for Labor Market Studies at Northeastern University - October 2009 5
Economic Costs of the Dropout Crisis Lifetime economic cost to society of a dropout vs. high school graduate: Lower contributions of federal, state, and local tax payments. * Higher in-kind transfer costs (welfare spending, unemployment payments, food stamps, etc) and incarceration expenditures * Additional healthcare expenditures ** $180,997 $124,362 $16,091 $321,450 • Source: "The Consequences of Dropping Out of High School" by The Center for Labor Market Studies at Northeastern University - October 2009. • ** Source: "Potential Economic Impacts of Improved Education on Colorado" by the Alliance for Excellent Education - October 2009 6
Economic Costs of the Dropout Crisis (cont.) Average number of reported dropouts during each of the past seven years. Historic data indicates approximately 85% of those dropouts will not return and complete high school Lifetime economic cost of each dropout 14,958 85% 12,714 x $ 321,450 Total lifetime cost to Colorado and the U.S. for a single year’s “cohort” of Colorado dropouts $ 4,086,933,669 7
Signs of Progress Orange bars represent the annual dropout rate by year for Colorado. For an explanation of how the dropout rate is calculated, see slide #25 The blue space and blue numbers above each bar represent the number of students who would have dropped out each year if the dropout rate had remained at the 2005-06 level of 4.5% 25,825 students xx 5% 2,991 4.5% 410 3,788 5,739 6,223 6,674 4.4% 4% 3.8% 3.6% 3% 3.1% 3.0% 2.9% Statewide Annual Dropout Rate 2% 1% 0% 8 2005-06 2006-07 2007-08 2008-09 2009-10 2010-11 2011-12
The statewide graduation rate has increased slightly each of the past three years A mandated change in graduation rate calculation occurred between 2009 and 2010 For an explanation of how the graduation rate is calculated, see slide #25 10
Colorado’s graduation rate in a national context 4-Year Graduation Rate by State – Class of 2011 Iowa Nevada Colorado Wash. D.C.
Colorado Statewide Graduation and Completion Rates Over Time for the Class of 2010 84.3 81.9 75.8 7-Year rates will be available January 2014 “On-time” rate (4 years or less) 2010 5-year rate calculated in 2011 6-year rate calculated in 2012 7-year rate calculated in 2013 XX Completion Rate(Graduates plus GED recipients and other non-graduating high school completers) Graduation Rate (Recipients of a district-issued diploma) xx 12
Education Outcomes Gaps • By Race/Ethnicity • By Instructional Program Type
Substantial “outcomes gaps” exist between White students and their Black, Hispanic and American Indian peers 14
Similar gaps exist among students in various Instructional Program categories 15
Annual Dropout Rate by Instructional Program Service Type: 6-Year Trend 8.5% 5.7% 5.1% 4.5% 4.4% 3.5% 3.8% 3.6% 3.2% 3.1% 3.0% 2.9% 2.2%
Growth in student populations from 2005 to 2012 Percent Growth in Student Count -70.1 Free or Reduced Lunch Minority Race/ Ethnicity Total Pupil Count (PK-12) English Language Learners Special Education Title 1 Section 504 Handicapped Homeless Migrant Fall 2012 Count 863,561 2,257 84,410 124,701 197,814 358,889 14,286 9,350 383,195 Percent of All Students 100% 0.3% 9.8% 14.4% 22.9% 41.6% 1.7% 1.1% 44.4%
The Colorado Graduation Pathways research-based framework for dropout prevention Essential Elements Methods & Tactics Data Analysis Early Warning Systems Tracking Out-of-School Youth Identification Assess and Enhance School Climate Policy and Practices Review Community Engagement Institutional Change Family Involvement Transition Programs (middle school to high school, high school to postsecondary) Alternative Pathways to Graduation (expanded curriculum, CTE, concurrent enrollment, etc) Intervention & Support Reengagement of Out-of-School Youth Enhanced Counseling and Mentoring Credit Recovery Options
Significant Legislation Related to Dropout Prevention and Student Engagement • The Education Accountability Act of 2009 (SB 09-163) • Postsecondary and Workforce Readiness Indicators must be included in High School and District Performance Frameworks (graduation rates, dropout rates, ACT scores). • Identified districts must develop Priority Improvement or Turnaround plans. • Alternative accountability measures for Alternative Education Campuses. • The Dropout Prevention and Student Re-Engagement Act(HB 09-1243) • Requires identification of “high priority” districts in need of assistance to improve graduation rates. These districts are required to complete a practices assessment and a graduation and completion plan as part of the UIP process. • Creates the Office of Dropout Prevention and School Engagement within CDE • Amends previous legislation such as parental notification when a student drops out of school. • Repeals the mandate to expel habitually disruptive students. 20
Significant Legislation (cont.) • Preschool to Postsecondary Education Alignment Act (HB 07-1118 / SB 08-212) • Introduces endorsed diplomas and calls for development of high school graduation guidelines (criteria for indicating a student’s level of post- secondary and workforce readiness upon graduation) • School Counselor Corps Grant Program (HB 08-1370) • Supports over 70 secondary counselors who provide services to over 82,000 students • Created to increase the graduation rate and increase the percentage of students who appropriately prepare for, apply to, and continue into postsecondary education • Concurrent Enrollment Programs Act (HB 09-1319/SB 285) • Calls for coordinating and clarifying existing concurrent enrollment programs • Creates the “5th year” ASCENT program to provide instruction by the high school beyond the senior year for eligible students. • Individual Career and Academic Plans (ICAP) SB 09-256 • Assists students in developing and maintaining a personalized plan that ensures readiness for post-secondary and workforce success 21
Visualizing current legislation and policies Maximum age for public per pupil funding = 21 Students requiring > 4 years to finish high school are counted as “late” graduates Non-graduating completers (GED, etc) count against the graduation rate All students assigned an unchanging “Anticipated Year of Graduation” upon entering 9th grade 22
Legislation and policies – “accommodations” • Although state per-pupil funding cannot be provided for students over age 21, students can be reported as graduates or completers up to age 23. • Colorado tracks 4-, 5-, 6- and 7-year grad. & completion rates and uses “best of” for state accountability. • Colorado received a waiver from USDE to use state frameworks in place of federal accountability. • Alternative Ed. Campuses are accountable for their completion rate in place of grad. rate, and may also include a transition rate. • Upon appeal, districts and schools may be allowed to use the completion rate instead of grad. rate for PWR. Maximum age for funding = 21 Completers count against the grad. rate “On time” = 4 years “Anticipated Year of Graduation” upon entering 9th grade • 8th grade students from prior year reported as “retained in grade” are not assigned to a graduation cohort. • First time 9th graders reported on the End of Year collection as transferring back to 8th grade before October 1st are not assigned to a graduation cohort.
Thank You! Peter Fritz Principal Consultant Colorado Department of Education Office of Dropout Prevention and Postsecondary Readiness (303) 866-6601 fritz_p@cde.state.co.us May 13, 2013
Overview of the rate calculations for graduation, completion, and dropout Graduation Rate Completion Rate Dropout Rate Annual (July 1 to June 30) 4-year cohort (Class of…) 4-year cohort (Class of…) Time period # of students receiving a diploma, GED certificate, or designation of high school completion within 4 years of initially entering 9th grade # of students receiving a diploma within 4 years of initially finishing 8th grade Number of reported dropouts and “age outs” during the past year Numerator # of students finishing 8th grade four years earlier + transfers in – verified transfers out # of students finishing 8th grade four years earlier + transfers in – verified transfers out # of students that were in membership in grade 7-12 at any time during the past year Denominator 2.9% 12,256 dropouts / 420,667 students in membership in grades 7-12 Statewide 2011-12 rate (and count) 75.4% 45,879 graduates / membership base of 60,885 75.8% 47,626 completers / membership base of 60,885 5-, 6-, and 7-year graduation rates are also calculated and posted for each cohort 5-, 6-, and 7-year completion rates are also calculated and posted for each cohort Students transferring to a GED program are not counted as dropouts in the dropout rate Notes 25