Download

1 / 52
520 likes | 535 Views
Learn about the setup and structure of MEG/EEG experiments, triggers for synchronization, types of stimulation devices, and data acquisition and analysis. Held on November 14th, 2006 at the Institute for Biomagnetism and Biosignal Analysis.

E N D
MEG ExperimentsStimulation and Recording Setup,Overview on Data Analysis Educational Seminar Institute for Biomagnetism and Biosignalanalysis November 14th, 2006
Outlet Stimulation and Recording Setup • general structure of an MEG / EEG experiment • Triggers, a way of cross-talk between stimulation and data recording • types of stimulation (devices) and their setup • data acquisition setup
General Structure of an MEG / EEG Experiment Alternative
Structure of a Run • Stimulus Onset Asynchrony (SOA) and Inter Stimulus Interval (ISI) might be randomized • Trial duration has to fixed for acquisition setup • recordings can be done in multiple or single trial mode (continuous) • multiple trials can be recorded with or without gap (semi continuous) • multiple trials can be recorded event related (sync) or in user defined blocks
Structure of a Trial trial might contain more than one stimulus / event activating the same or different modalities
Triggers, a way of cross-talk between Stimulation and Data Recording • generated by • stimulation control software (Presentation) • stimulus detection devices (photo diode / sound (onset) detector) • subject response unit (response buttons) • used to • synchronize recording and analysing intervals (run / trial onset) • mark stimulus appearance (event timing) • define stimulus type, conditions (event coding) • sent to and acquired by the MEG electronic • stored in data set (trigger portchannels / Markerfile)
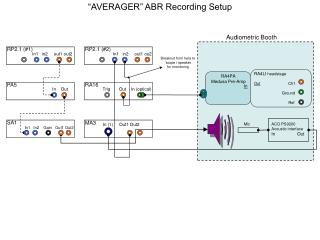
Trigger Interface Unit ECCVSM Omega 2005 WC MEG System • several ports having different connector types (parallel, serial, BNC etc.) • parallel port 1 • 8 lines connected to the stimulation computer (controled by the Presentation Software) • parallel port 2 • 8 lines connected to photo diode, sound onset detector and response button unit (6 lines) • DACchannels • can be used for trigger in- and output from resp. to external devices
Triggers / Markers Representation in the Dataset • time series oftriggers are stored in the trigger port channels in the data set • (visible during recording) • triggers are stored as markers in the Markerfile with a user defined label and time offset to trial synchronizing trigger • trigger 1 active at 0 ms after sync trigger entry for marker1, delay = 0.0 s • trigger 2 active at 16 ms after sync trigger entry for marker2, delay = 0.016 s • both triggers simultaneously active entry for both markers as described above
Types of Stimulation • auditory stimulation • visual stimulation • somato-sensory stimulation • pneumato-tactile • electric (Grass stimulator, media-nerve stimulation) • vibro tactile • olfactoric stimulation • During an MEG recording all these types of stimulation can be applied simultaneously (multi-modal).
Auditory Stimulation (cont´d) • trial and stimulus sequence controlled by Presentation software • to be prepared:soundfiles (.wav), may contain trigger determination pulseto define real appearance time according to stimulus onset recommendation: to perform a hearing threshold measurement prior to a recording and to set the intensity of auditory stimuli according to the individual sensation level (dBSL)
Visual Stimulation (cont´d) • trial and stimulus sequence controlled by Presentation software • to be prepared: • image files (.jpeg / .img) containing marker generation spot • additionally to be adjusted: • position, angle of the projection screen • size of the projection (field of view) • brightness of the signal
Somato-Sensory Stimulationpneumato tactile (cont´d) • trial and stimulus sequence controlled by Presentation software Pulse length adjustable Stimulation (channel) patterns selectable
Somato-Sensory Stimulationvibro tactile 4 Piezo driven modules
Somato-Sensory Stimulationvibro tactile (cont´d) • trial and stimulus sequence controlled by a command line interface (not by Presentation, C++-Program) • modules are controlled independantly from each other • the activation time course (amplitude, frequency) can be individually defined for each pin (e.g. Amplitude modulated stimulation) • features pattern stimulation
Data Acquisition (Run Time Protocol) Setup General informations Accession No (Principal Investigator) Subject / Patient Information
Data Acquisition (Run Time Protocol) SetupChannel / Collection Settings Channel selection (MEG, MEG+EEG) Head localization procedure (before and/or after run, continuous during run) Collection parameters (recording mode: trial mode or continuous)
Data Acquisition (Run Time Protocol) SetupFilter Settings Online Hardware Filter (default: off) Env. Noise Reduction (gradiometer order, default: 3rd order)
Data Acquisition (Run Time Protocol) SetupTrigger Settings PPort2: 8 lines Line1: sound onset detector Line2: photo diode Line3-8: response buttons PPort1: 8 lines (default: reserved for Presentation) Optional: Use one of the triggers to synchronize a multiiple trial recording
Data Acquisition SetupEEG Recording Setup • select number of electrodes to be recorded (e.g. 64 channel cap) • (max. 120 uni- and 8 bipolar channels) • define label and position of electrodes (e.g. from Polhemus scan) • define online high pass filter (default: no filter) • perform impedance check and null offset correction prior to recording
Data Acquisition Setup (cont‘d) prior to a MEG / EEG recording: • EEG cap setup (?) • Polhemus scan (?) • seat subject in most confortable (and stable) position under dewar • (online) noise measurement under experimental conditions • attach the head localization coils to the subject • connect subject to stimulation (and response) equipment • perform a stimulus threshold measurement (hearing level, field of view)
OutletData Analysis Administration / Storage of Data Visualization of MEG Data MEG Data Processing MRI Data Processing Source Modeling Source Analysis Results Processing
Data Administration / Storage • recorded data have to be copied from acquisition computer to data storage server • megacq to megserver:/data/megserver1/PI/Experiment(normally done by the technicians) • for further analysis a backup of the data should be copied to personal workspace computer • daily backup of the recorded raw data to DVD (done by the technicians) • all recorded data will get an entry in the database • (personally) analysed data have to be backuped by the users • after completing analysis of an experiment all belonging data have to be deleted from the data storage server
Data Preparation most useful programs for data preparation: newSingleTrialDs merge multiple trials (having no gap) to a continuous data set newDs: separation of conditions, resampling, sensor type separation, recording mode modification addMarker:trigger decoding, trial / condition classification changeDsName:rename data set dshead, dsinfo:get information about data set
General Aspects on Dataset Analysis using the CTF software • processing parameters are applied online (data storage in raw format) • (!! BESA does not recognize processing parameters but takes noise reduction level into account) • almost all analysis procedures can be performed either by command line programs or by tools supported by a graphical user interface • central toolbox (GUI): DataEditor • CTF dataset are folders containing several files, e.g. .meg4 MarkerFile.mrk BadChannels processing.cfg
Data Visualization • (Single) channel waveform • Channel overlay • (butterfly plot) • Sensor layout • Field Distribution • contour map
Artifact Rejection Artifact Rejection Offset Removal, Filtering MEG Data ProcessingOverview MEG / (EEG) MRI Converting MEG / MRI Co registration Averaging Creating a Head Model Additional Data Processing Source Modelling
Artifact (trial) rejection : • by template selection MEG Data ProcessingArtifact Rejection Main artifacts in MEG data: • eye movements • muscle activity • MCG (heart activity) • (spontaneous) brain activity from areas not of interest (e.g. alpha waves) • by threshold detection (GUI tool, ctf_PtP_detection) • Manually Exclude channels (-> BadChannels file)
Artifact Rejection Offset Removal, Filtering MEG / (EEG) MRI Converting Averaging MEG / MRI Coregistration Averaging Creating a Head Model Additional Data Processing Source Modelling
MEG Data ProcessingAveraging (in time space) For evoked activity used to: • increase signal to noise ratio • seperate by conditions (selective averaging) For induced activity a (time) frequency analysis (FFT, wavelet anal.) has to be applied prior to averaging in frequency space
Artifact Rejection Offset Removal, Filtering Offset Removal, Filtering MEG / (EEG) MRI Converting MEG / MRI Co registration Averaging Creating a Head Model Additional Data Processing Source Modelling
MEG Data ProcessingOffset Removal, temporal Filtering Offset Removal: by subtracting mean of the pre trigger interval the whole trial a defined latency range from each channel Filter Options: low pass high pass band pass notch filter Remove Power Line Interference + harmonics Remove Linear Trend
Artifact Rejection Offset Removal, Filtering MEG / (EEG) MRI Converting MEG / MRI Coregistration Averaging Creating a Head Model Additional Data Processing Additional Data Processing Source Modelling
MEG Data ProcessingAdditional Data Processing Steps Frequency / Power spectrum (FFT) Time Frequency Analysis Methods (Wavelet Transformation etc.) Difference between / Sum of dataset Event detecting / marking (condition linking) RMS Power / Global Field Power Grand average (several sessions, several subjects) !! not recommended in sensor domain !!
MEG Data ProcessingAdditional Data ProcessingRMS Value • estimation of the signal power • estimation of the signal to noise ratio • detection of signal power peaks • collapsing the channels to one curve Bc = magnetic field of channel c, N = number of channels
Artifact Rejection Offset Removal, Filtering MEG / (EEG) MRI Converting Converting MEG / MRI Coregistration Averaging Creating a Head Model Additional Data Processing Source Modelling
MRI Data ProcessingConverting 2-dimensional MRI slices volumetric data set Supported MRI formats: • Dicom3 • ACR-NEMA • Siemens • GE Genesis • Analyse (default IBB) • MINC (MNI) • Generic
Artifact Rejection Offset Removal, Filtering MEG / (EEG) MRI Converting MEG / MRI Coregistration Averaging MEG / MRI Coregistration Creating a Head Model Additional Data Processing Source Modelling
MRI Data ProcessingMEG/MRI Coregistration Define fiducial positions in MRI slices to match up MEG and MRI coordinate systems
Artifact Rejection Offset Removal, Filtering MEG / (EEG) MRI Converting MEG / MRI Coregistration Averaging Creating a Head Model Creating a Head Model Additional Data Processing Source Modelling
MRI Data ProcessingCreating an (individual) head model Assumption: human head acts like spherical volume conductor for B-fields Define a sphere origin and radius • Fit a sphere to manually defined markersor input headshape points from an external source(polhemus) • Fit sphere to the computer extracted head surface • Operator defined sphere parameters Head Model for SourceModelling(all steps done by technicians, results stored in a general folder available on all computers)
Artifact Rejection Offset Removal, Filtering MEG / (EEG) MRI Converting MEG / MRI Coregistration Averaging Creating a Head Model Additional Data Processing Source Modelling Source Modelling
Source Modelling Goal: to estimate the source(s) underlying a magnetic field distribution • Assumption: • head asaspherical volume conductor • source asan equivalent current dipole • Approach: • set some constraints (e.g. fit interval, source model, relationship between dipoles) • perform the dipole fit • Results: • location, orientation and strength (moment) of equivalent current dipole(s) • validation criterias:fit error, residual field, plausibility
Source ModellingSignal Space Projection • define a spatial filter • the measured magnetic field is multiplied with a weighting vector W • this vector depends as well on the channel configuration and their properties • as on the localization and orientation of a chosen source underlying the field • built up of a virtual sensor • which responds maximal to the region of interest (spatial sensitive) • contribution of spontaneous brain activity from other regions is reduced • uncorrelated system noise is canceled out • output: timeseries of the source strength (dipole moment) (source waveform) • profit of the virtual sensor: • collapsing the signal of all MEG channels to one single waveform • further processing of the source waveform • method to compare intra individual source analysis results (different components) • method to compare inter individual results (group analysis)
Source ModellingSignal Space Projection (Performing) • assume one or more dipole(s) with fixedposition and orientation • calculate the source strength by adapting the dipole moment(s) to the measured field distribution
Source Analysis ResultsIntegration MEG and MRI Data Overlay of functional and anatomical data Proof of plausibility (matching anatomical structures ?)
Source Analysis ResultsGroup Analysis (localization) Average in source space, 9 subjects, confidence intervals of the mean (95 %)