Download
1 / 31
310 likes | 390 Views
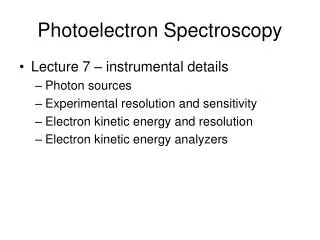
PHOTOELECTRON SPECTROSCOPY. Spectroscopy uses interaction of electromagnetic radiation with matter to learn something about the matter. Characteristics of absorbed, emitted or scattered electromegnetic radiation are measured Photoelectron spectroscopy is entirely different!

E N D
Spectroscopy uses interaction of electromagnetic radiation with matter to learn something about the matter. • Characteristics of absorbed, emitted or scattered electromegnetic radiation are measured • Photoelectron spectroscopy is entirely different! • Kinetic energies of the ionized electrons are monitored • It is an extension of PHOTOELECTRIC EFFECT
e- e- e- Photoelectric Effect Ionization occurs when matter interacts with light of sufficient energy (Heinrich Hertz, 1886) (Einstein, A. Ann. Phys. Leipzig 1905, 17, 132-148.) hn Ehn = electron kinetic energy + electron binding energy Photoelectron spectroscopy uses this phenomenon to learn about the electronic structure of matter
Ionization continuum Virtual orbitals (empty) E N E R G Y hn = I.E + K.E PHOTO IONIZATION PHOTO EXCITATION Valence level (partially filled) Core level (completely filled) Excitation and Photoionization Processes from Core & Valence level
Photoelectron spectroscopy is based on Einstein's photoelectric effect. A photon can ionize an electron from a molecule if the photon has an energy greater than the energy holding the electron in the molecule. Any photon energy in excess of that needed for ionization is carried by the outgoing electron in the form of kinetic energy.
INSTRUMENTATION UV P.E.S. He(I) - 21.22 ev. Ar (I), He (II) XPS Mg Ka – 1253.6 ev Al Ka – 1486.6 ev •
P. E. S. of Molecules Electron signal Counts/s secsecec • Spectrum consists of bands, corresponding to ionizations from individual orbitals. • Bands may have a single peak or consist of a series of peaks (fine structure), arising from excitations to the various vibrational-rotational states of the ion, M+. (Usually, only vibrational fine structure is resolved.) • Spin-orbital coupling (producing two distinct J values and corresponding energies) or Jahn-Teller effects (causing splitting of degenerate states) can cause additional band splitting.
Molecular Ionization from a Non-Bonding MO Ionization from a non-bonding M.O. does not change bond length, so the vertical transition is the adiabatic transition, M(v = 0) to M+ (v' = 0). P.E.S. bands for ionizations from non-bonding M.O.s tend to have little or no vibrational fine structure.
Molecular Ionization from a Bonding MO Ionization from a bonding or anti-bonding M.O. causes a change in bond length in the ion M+, compared to the bond length in M. • The vertical transition is to an M+ vibrational state v' > 0 with maximum wave-function overlap at the same inter-nuclear separation as the normal bond length of the neutral molecule, M. (Not the adiabatic transition). • Transitions to other v' states are possible with lesser probability, resulting in vibrational fine structure on the ionization band. The frequency separations between the vibrational peaks can be used to calculate the vibrational frequency of the ion, M+. P.E.S. bands for ionizations from bonding or antibonding M.O.s tend to have pronounced vibrational fine structure.
Ionizations as State-to-State Transitions Possible ionizations may be viewed as state-to-state transitions. • Adiabatic Transition - Transition from M in v = 0 to M+ in v' = 0. • Vertical Transition - Transition without change in bond length (Franck-Condon Principle).
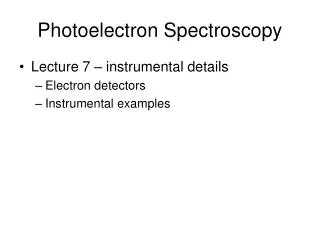
MO diagram & Photoelectron spectrum of H2 PES of H – atom one peak at 13.60 ev H + hn H+ + e- 1S1 + hn 1S0 + e- 1S 1S PES of H2 15.45 ev to 18 ev H 2 (sgb)2 + hn H2+ (sgb)1 + e- (sgb)2 electrons are more stable than1S1 electron of H-atom First Peak at 15.45 ev n=0 of H 2 to n’ = 0 of H2+ so Adiabetic Ionization Energy Most Intense Peak n=0 of H 2 to n’ = 2 of H2+ so Vertical Ionization Energy
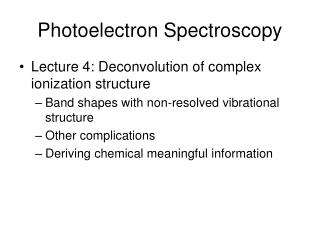
MO diagram & Photo Electron Spectrum of O2. Vibrational frequency of O2 = 1568 cm-1
3sg (p) 1Pu 1Pg O2 ground state O2+ 3sg (p) quartet spin down e- ionized 4Sg O2+ 3sg (p) doublet spin up e- ionized 2Sg 3sg (p) 1Pu 1Pg O2 ground state O2+ 1Pu quartet spin down e- ionized 4Pu O2+ 1Pu doublet spin up e- ionized 2Pu
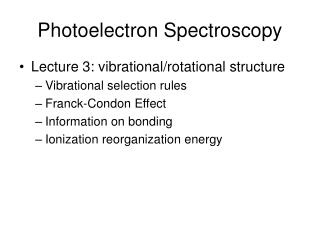
MO diagram & Photoelectron spectrum of N2 Quantum mechanical calculations – The order of energies of orbitals (2sg)2 (2su)2 (3sg)2 (1Pu)4 Koopman’s Theoram Most widely used approximation IEn = - En Valid for one e- atoms From PES – The lowest ionic state of N2+ (2sg)2 (2su)2 (1Pu)4(3sg)1 For multi electron atoms & molecules, “frozen orbital” approximation Still valid provided the orbitals in the ionized molecule are unchanged from those of the neutral molecules The ordering of the orbitals in the ground state Different from that of the molecule ion Breakdown of Koopman’s theoram s-p mixing
s-p mixing Interactions or mixing between2sand2pzAOs cause a reordering of the MOs . This mixing results in a decrease in energy for MO1and MO2, while MO3and MO6increase. Hence2σuand1πuswitch positions (b). This switch is the order that is observed forLi2 … N2, whileO2andF2show the order in(a). Mixing between 2s and 2pz AOs leads to a new arrangement of MOs (b).
MO diagram & Photoelectron spectrum of F2 1pg 1pg 1pu 3sg 1pu 3sg 1pg band shows vibrational fine structure Increase in n F2+ - antibonding Same orbital energy sequence as that of O2
MO diagram & Photoelectron spectrum of CO CO is isoelectronic with N2 PES is similar
MO diagram & Photoelectron spectrum of HF 1p 2s 1s 16 18 20 38 40 42
MO diagram & Photoelectron spectrum of NH3 3a1 10.88 ev 1e 16.0 ev
MO diagram & Photoelectron spectrum of water 1b1 3a1 1b2
XPS (ESCA) BE of core electrons of atom in sample - BE of core electrons of atom in standard environment
CH3CH2CH2COONa [Co(NH2CH2CH2NH2)2(NO2)2]NO3 1:3 NH2 4:2:1 NO2 CH3CH2COONa NO3 1:2 CH3COONa 1:1 HCOONa C 1S XPS CF3COOCH2CH3 CO : CH 1:0 280 285 290 IP IP
N 1S XPS of Na2N2O3 _ O _ _ O = N – O – N – O _ _ O – N = N- O – O O = N – N _ O I II III XPS structurally non-equivalent nitrogen atoms MO calculations & detailed BE considerations structure II O R – S – S – R R – S – S – R O O O I II Two sulphur core lines , so structure II
Elemental Analysis: atoms have valence and core electrons: Core-level Binding energies provide unique signature of elements. • Quantitative analysis: measure intensities, use standards or tables of sensitivity factor
When atom loses valence charge (Si0 --> Si4+ ) BE increases. • When atom gains valence charge (O --> O--) BE decreases.
Auger Electron Spectroscopy KL1L2 Process
Summary • PES is a fairly new technique, continuing to develop • PES has unique features compared to other spectroscopies • Valence spectroscopy: information on bonding • Core spectroscopy: qualitative and quantitative analysis, “chemical shift”
References International series of Monographs, Vol. 53: Photoelectron Spectroscopy, D. Beckerand D. Betteridge Physical Methods for Chemists, Russell S. Drago Electronic Absorption Spectroscopy and Related Techniques D.N. Satyanarayana