Download
1 / 39
540 likes | 933 Views
X-Ray Photoelectron Spectroscopy (XPS). David Echevarría Torres University of Texas at El Paso College of Science Chemistry Department. XPS Background XPS Instrument How Does XPS Technology Work? Auger Electron Cylindrical Mirror Analyzer (CMA) Equation KE versus BE Spectrum Background

E N D
X-Ray Photoelectron Spectroscopy (XPS) David Echevarría Torres University of Texas at El Paso College of Science Chemistry Department
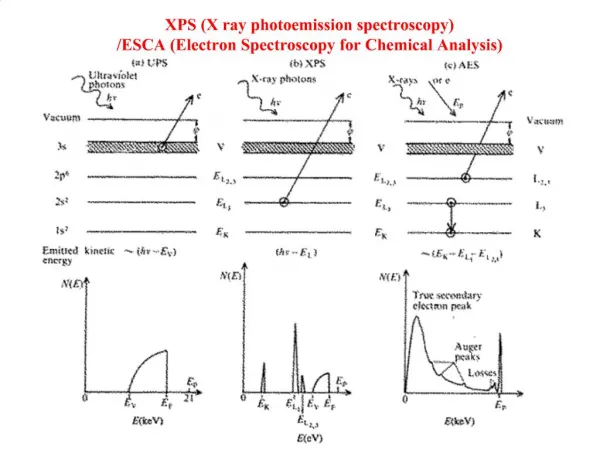
XPS Background XPS Instrument How Does XPS Technology Work? Auger Electron Cylindrical Mirror Analyzer (CMA) Equation KE versus BE Spectrum Background Identification of XPS Peaks X-rays vs. e- Beam XPS Technology Outline
XPS Background • XPS technique is based on Einstein’s idea about the photoelectric effect, developed around 1905 • The concept of photons was used to describe the ejection of electrons from a surface when photons were impinged upon it • During the mid 1960’s Dr. Siegbahn and his research group developed the XPS technique. • In 1981, Dr. Siegbahn was awarded the Nobel Prize in Physics for the development of the XPS technique
X-Rays • Irradiate the sample surface, hitting the core electrons (e-) of the atoms. • The X-Rays penetrate the sample to a depth on the order of a micrometer. • Useful e- signal is obtained only from a depth of around 10 to 100 Å on the surface. • The X-Ray source produces photons with certain energies: • MgK photon with an energy of 1253.6 eV • AlK photon with an energy of 1486.6 eV • Normally, the sample will be radiated with photons of a single energy (MgK or AlK). This is known as a monoenergetic X-Ray beam.
Valence e- Core e- Atom Why the Core Electrons? • An electron near the Fermi level is far from the nucleus, moving in different directions all over the place, and will not carry information about any single atom. • Fermi level is the highest energy level occupied by an electron in a neutral solid at absolute 0 temperature. • Electron binding energy (BE) is calculated with respect to the Fermi level. • The core e-s are local close to the nucleus and have binding energies characteristic of their particular element. • The core e-s have a higher probability of matching the energies of AlK and MgK.
0 B.E. x p+ Binding Energy (BE) The Binding Energy (BE) is characteristic of the core electrons for each element. The BE is determined by the attraction of the electrons to the nucleus. If an electron with energy x is pulled away from the nucleus, the attraction between the electron and the nucleus decreases and the BE decreases. Eventually, there will be a point when the electron will be free of the nucleus. This is the point with 0 energy of attraction between the electron and the nucleus. At this point the electron is free from the atom. These electrons are attracted to the proton with certain binding energy x
Vacumm Level Ø, which is the work function Fermi Level At absolute 0 Kelvin the electrons fill from the lowest energy states up. When the electrons occupy up to this level the neutral solid is in its “ground state.” BE Lowest state of energy Energy Levels
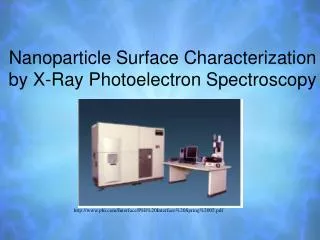
XPS Instrument • XPS is also known as ESCA (Electron Spectroscopy for Chemical Analysis). • The technique is widely used because it is very simple to use and the data is easily analyzed. • XPS works by irradiating atoms of a surface of any solid material with X-Ray photons, causing the ejection of electrons. University of Texas at El Paso, Physics Department Front view of the Phi 560 XPS/AES/SIMS UHV System
XPS Instrument The XPS is controlled by using a computer system. The computer system will control the X-Ray type and prepare the instrument for analysis. University of Texas at El Paso, Physics Department Front view of the Phi 560 XPS/AES/SIMS UHV System and the computer system that controls the XPS.
XPS Instrument • The instrument uses different pump systems to reach the goal of an Ultra High Vacuum (UHV) environment. • The Ultra High Vacuum environment will prevent contamination of the surface and aid an accurate analysis of the sample. University of Texas at El Paso, Physics Department Side view of the Phi 560 XPS/AES/SIMS UHV System
XPS Instrument X-Ray Source Ion Source SIMS Analyzer Sample introduction Chamber
Sample Introduction Chamber • The sample will be introduced through a chamber that is in contact with the outside environment • It will be closed and pumped to low vacuum. • After the first chamber is at low vacuum the sample will be introduced into the second chamber in which a UHV environment exists. First Chamber Second Chamber UHV
X-Ray source Ion source Detector SIMS Analyzer Axial Electron Gun Sample introduction Chamber Sample Holder sample CMA Slits Roughing Pump Ion Pump Diagram of the Side View of XPS System
A monoenergetic x-ray beam emits photoelectrons from the from the surface of the sample. The X-Rays either of two energies: Al Ka (1486.6eV) Mg Ka (1253.6 eV) The x-ray photons The penetration about a micrometer of the sample The XPS spectrum contains information only about the top 10 - 100 Ǻ of the sample. Ultrahigh vacuum environment to eliminate excessive surface contamination. Cylindrical Mirror Analyzer (CMA) measures the KE of emitted e-s. The spectrum plotted by the computer from the analyzer signal. The binding energies can be determined from the peak positions and the elements present in the sample identified. How Does XPS Technology Work?
Why Does XPS Need UHV? • Contamination of surface • XPS is a surface sensitive technique. • Contaminates will produce an XPS signal and lead to incorrect analysis of the surface of composition. • The pressure of the vacuum system is < 10-9 Torr • Removing contamination • To remove the contamination the sample surface is bombarded with argon ions (Ar+ = 3KeV). • heat and oxygen can be used to remove hydrocarbons • The XPS technique could cause damage to the surface, but it is negligible.
proton neutron electron electron vacancy The Atom and the X-Ray X-Ray Free electron Valence electrons Core electrons The core electrons respond very well to the X-Ray energy
e- lower layer but no collisions e- top layer Outer surface e- lower layer with collisions X-Rays Inner surface Atoms layers X-Rays on the Surface
X-Rays on the Surface • The X-Rays will penetrate to the core e- of the atoms in the sample. • Some e-s are going to be released without any problem giving the Kinetic Energies (KE) characteristic of their elements. • Other e-s will come from inner layers and collide with other e-s of upper layers • These e- will be lower in lower energy. • They will contribute to the noise signal of the spectrum.
X-Rays and the Electrons X-Ray Electron without collision Electron with collision The noise signal comes from the electrons that collide with other electrons of different layers. The collisions cause a decrease in energy of the electron and it no longer will contribute to the characteristic energy of the element.
What e-s can the Cylindrical Mirror Analyzer Detect? • The CMA not only can detect electrons from the irradiation of X-Rays, it can also detect electrons from irradiation by the e- gun. • The e- gun it is located inside the CMA while the X-Ray source is located on top of the instrument. • The only electrons normally used in a spectrum from irradiation by the e- gun are known as Auger e-s. Auger electrons are also produced by X-ray irradiation.
X-Rays and Auger Electrons • When the core electron leaves a vacancy an electron of higher energy will move down to occupy the vacancy while releasing energy by: • photons • Auger electrons • Each Auger electron carries a characteristic energy that can be measured.
Two Ways to Produce Auger Electrons • The X-Ray source can irradiate and remove the e- from the core level causing the e- to leave the atom • A higher level e- will occupy the vacancy. • The energy released is given to a third higher level e-. • This is the Auger electron that leaves the atom. The axial e- gun can irradiate and remove the core e- by collision. Once the core vacancy is created, the Auger electron process occurs the same way.
Auger Electron 2 e- of high energy that will occupy the vacancy of the core level Free e- 3 e- released to analyze 4 1 e- gun e- Vacancy 1, 2, 3 and 4 are the order of steps in which the e-s will move in the atom when hit by the e- gun.
Auger Electron Spectroscopy (AES) e- released from the top layer Outer surface Inner surface Electron beam from the e- gun Atom layers
Cylindrical Mirror Analyzer (CMA) • The electrons ejected will pass through a device called a CMA. • The CMA has two concentric metal cylinders at different voltages. • One of the metal cylinders will have a positive voltage and the other will have a 0 voltage. This will create an electric field between the two cylinders. • The voltages on the CMA for XPS and Auger e-s are different.
Cylindrical Mirror Analyzer (CMA) • When the e-s pass through the metal cylinders, they will collide with one of the cylinders or they will just pass through. • If the e-’s velocity is too high it will collide with the outer cylinder • If is going too slow then will collide with the inner cylinder. • Only the e- with the right velocity will go through the cylinders to reach the detector. • With a change in cylinder voltage the acceptable kinetic energy will change and then you can count how many e-s have that KE to reach the detector.
X-Rays Source 0 V 0 V +V +V +V +V Sample Holder 0 V 0 V Cylindrical Mirror Analyzer (CMA) Electron Pathway through the CMA Slit Detector
Equation KE=hv-BE-Ø KE Kinetic Energy (measure in the XPS spectrometer) hv photon energy from the X-Ray source (controlled) Ø spectrometerwork function. It is a few eV, it gets more complicated because the materials in the instrument will affect it. Found by calibration. BE is the unknown variable
Equation • The equation will calculate the energy needed to get an e- out from the surface of the solid. • Knowing KE, hv and Ø the BE can be calculated. KE=hv-BE-Ø
# of electrons E E E Binding energy (eV) KE versus BE KE can be plotted depending on BE Each peak represents the amount of e-s at a certain energy that is characteristic of some element. BE increase from right to left 1000 eV 0 eV KE increase from left to right
The X-Ray will hit the e-s in the bulk (inner e- layers) of the sample e- will collide with other e- from top layers, decreasing its energy to contribute to the noise, at lower kinetic energy than the peak . The background noise increases with BE because the SUM of all noise is taken from the beginning of the analysis. N = noise N4 # of electrons N3 N2 N1 Binding energy Ntot=N1 + N2 + N3+ N4 Interpreting XPS Spectrum: Background
XPS Spectrum • The XPS peaks are sharp. • In a XPS graph it is possible to see Auger electron peaks. • The Auger peaks are usually wider peaks in a XPS spectrum. • Aluminum foil is used as an example on the next slide.
XPS Spectrum O 1s O Auger O because of Mg source C O 2s Al Al Sample and graphic provided by William Durrer, Ph.D. Department of Physics at the Univertsity of Texas at El Paso
Auger Spectrum Characteristic of Auger graphs The graph goes up as KE increases. Sample and graphic provided by William Durrer, Ph.D. Department of Physics at the Univertsity of Texas at El Paso
Identification of XPS Peaks • The plot has characteristic peaks for each element found in the surface of the sample. • There are tables with the KE and BE already assigned to each element. • After the spectrum is plotted you can look for the designated value of the peak energy from the graph and find the element present on the surface.
X-rays vs. e- Beam • X-Rays • Hit all sample area simultaneously permitting data acquisition that will give an idea of the average composition of the whole surface. • Electron Beam • It can be focused on a particular area of the sample to determine the composition of selected areas of the sample surface.
Consider as non-destructive because it produces soft x-rays to induce photoelectron emission from the sample surface Provide information about surface layers or thin film structures Applications in the industry: Polymer surface Catalyst Corrosion Adhesion Semiconductors Dielectric materials Electronics packaging Magnetic media Thin film coatings XPS Technology
References • Dr.William Durrer for explanations on XPS technique, Department of Physics at UTEP. • www.uksaf.com • www.casaxps.com • www.nwsl.net • XPS instrument from the Physics Department.
Acknowledgements • Elizabeth Gardner, Ph.D. from the Department of Chemistry at the University of Texas at El Paso • William Durrer, Ph.D. from the Department of Physics at the University of Texas at El Paso • Roberto De La Torre Roche • Lynn Marie Santiago