Interval Estimation in Statistics: Population Mean Scenarios
Understand how to estimate population mean with known and unknown standard deviation using interval estimation. Calculate confidence levels and margins of error for accurate statistics analysis.

Interval Estimation in Statistics: Population Mean Scenarios
E N D
Presentation Transcript
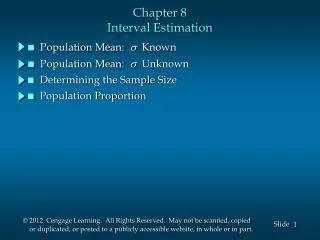
Chapter Outline • Population Mean: Known • Population Mean: Unknown • Population Proportion
Introduction • The sampling distribution introduced last chapter connects sample statistics to population parameters. • In reality, we probably don’t know any of the population parameters. However, a study on sampling distributions can provide reasonable references to the population parameters.
Margin of Error and the Interval Estimate • A point estimator cannot be expected to provide the exact value of the population parameter. For instance, the probability of any particular sample mean equal population mean is zero, i.e. p( = m) = 0. • An interval estimate can be computed by adding and subtracting a margin of error to the point estimate. • The purpose of an interval estimate is to provide a reasonable value range of the population parameters.
Margin of Error and the Interval Estimate • The general form of an interval estimates of a population mean is
Interval Estimate of A Population Mean: Known • In the first scenario, we assume to be known. Although is rarely known in reality, a good estimate can be obtained based on historical data or other information. • Let’s use the example of Checking Accounts from last chapter as an illustration. Here, we assume that the population standard deviation is known (=66). Our goal is to come up with an interval estimate of population mean based on the sample mean =280.
= Sample mean account balance = Sample pro- portion of account balance no less than $500 Summary of Point Estimates of A Simple Random Sample of 121 Checking Accounts Population Parameter Parameter Value Point Estimator Point Estimate m = Population mean account balance $310 $306 $66 s = Sample std. deviation for account balance $61 s = Population std. deviation for account balance .3 .27 p = Population pro- portion of account balance no less than $500
Interval Estimate of A Population Mean: Known • The sample mean distribution of 121 checking account balances can be approximated by a normal distribution with E( ) = . Let’s first figure out the values of that provide the middle area about of 95%. 95% a b
Interval Estimate of A Population Mean: Known • Example: Checking Accounts • Given the middle area of 95%, we can find z values first and then convert z values to the corresponding values of . 95% 95% 2.5% 2.5% z -z0.025 z0.025 a 0 b
Interval Estimate of A Population Mean: Known • Example: Checking Accounts • Convert z values to the corresponding values of .
[--------- -----------] Interval Estimate of A Population Mean: Known • Example: Checking Accounts • We set the margin of error as . So, the interval estimate of population mean is . As long as falls between a and b, the interval will include the population mean . 95% a b [--------- -----------] [--------- -----------]
Interval Estimate of A Population Mean: Known • Example: Checking Accounts The rationale behind the interval estimate – • For any particular sample mean , we cannot compare it with the population mean since is unknown. But, what we are certain is that as long as falls between a and b. The interval will include the true value of . • In the example, = 306. So, the interval estimate of population account balance is . Because z0.025=1.96 and , the interval estimate is calculated as 3061.96·6 = 306 11.76 or $294.24 to $317.76 • We are 95% confident that will fall between a and b. So, the chance is 95% that the true value of is no less than $294.24 and no more than $317.76. • On the other hand, there is a 5% chance that we make a mistake and the above interval estimate doesn’t include . Margin of Error
Interval Estimate of A Population Mean: Known • Interval Estimate of m where: is the sample mean 1 - is the confidence level z/2 is the z value providing an area of /2 in the upper tail of the standard normal probability distribution s is the population standard deviation n is the sample size
Interval Estimate of A Population Mean: Known • Values of za/2 for the Most Commonly Used Confidence Levels Confidence Area to the Level aa/2 left of za/2 za/2 90% .10 .05 1- a/2= .9500 1.645 95% .05 .025 1- a/2= .9750 1.960 99% .01 .005 1- a/2= .9950 2.576
Interval Estimate of A Population Mean: Known • Example: Checking Accounts Confidence Margin Level of Error Interval Estimate 90% 9.87 296.13 to 315.87 95% 11.76 294.24 to 317.76 99% 15.46 290.54 to 321.46 The higher the confidence level, the wider the Interval estimate.
Interval Estimate of A Population Mean: Unknown • When s is unknown, we will have to use the sample standard deviation s to estimate s . • In this case, the interval estimate for m is based on the t distribution. (See Table 2 of Appendix B in the textbook) • A specific t distribution depends on a parameter known as the degrees of freedom. • Degrees of freedom refer to the number of independent pieces of information that go into the computation of s. • As the degrees of freedom increases, t distribution is approaching closer to the Standard Normal Distribution.
t Distribution t distribution (20 degrees of freedom) Standard normal distribution t distribution (10 degrees of freedom) z, t 0
t Distribution • For more than 100 degrees of freedom, the standard normal z value provides a good approximation to the t value. • The standard normal z values can be found in the infinite degrees ( ) row of the t distribution table. Standard normal z values
Interval Estimate of A Population Mean: Unknown • Interval Estimate where: 1 - = the confidence level t/2 = the t value providing an area of /2 in the upper tail of a t distribution with n - 1 degrees of freedom s = the sample standard deviation n = sample size
Interval Estimate of A Population Mean: Unknown • Example: Consumer Age . The makers of a soft drink want to identify the average age of its consumers. A sample of 20 consumers was taken. The average age in the sample was 21 years with a standard deviation of 4 years. Construct a 95% confidence interval for the true average age of the consumers.
Interval Estimate of A Population Mean: Unknown • Example: Consumer Age At 95% confidence, = .05, and /2 = .025. t.025 is based on n - 1 = 20 - 1 = 19 degrees of freedom. In the t distribution table we see that t.025 = 2.093.
Interval Estimate of A Population Mean: Unknown • Example: Consumer Age Margin of Error We are 95% confident that the average age of the soft drink consumers is between 19.13 and 22.87.
Summary of Interval Estimation Proceduresfor a Population Mean Is the population standard deviation s known ? Yes No Use the sample standard deviation s to estimate s s Known Case Use Use s Unknown Case
Interval Estimate of A Population Proportion The general form of an interval estimate of a population proportion is
Interval Estimate of A Population Proportion • Just as the sampling distribution of is key in estimating population mean, the sampling distribution of is crucial in estimating population proportion. • The sampling distribution of can be approximated by a normal distribution whenever np 5 and n(1-p) 5.
Interval Estimate of A Population Proportion • Normal Approximation of Sampling Distribution of Sampling distribution of /2 /2 1 - p
Interval Estimate of A Population Proportion • Interval Estimate of where: 1 - is the confidence level z/2 is the z value providing an area of /2 in the upper tail of the standard normal probability distribution is the sample proportion
Interval Estimate of A Population Mean: Known • Example: Checking Accounts • Refer to our previous example of Checking Accounts. Out of the simple random sample of 121 accounts, the sample proportion of account balance no less than $500 is .27. Develop a 95% confidence interval estimate of the population proportion. where: n = 121, = .27, z/2 = 1.96 Margin of Error We are 95% confident that the proportion of all checking accounts with a balance no less than $500 is between .23 and .31, which correctly includes the population proportion .30.